")
The physical phenomenon of aerodynamic drag can be explained and understood, as we did in part 1 of this series on aerodynamics in cycling. However, measuring, assessing and making practical use of it is not easy. After all, races do not happen inside a wind tunnel.
We will cover how cross-winds add to complexity in the real world, computer simulations are always incomplete and even wind tunnel experiments are much more complicated than thought. You may embark on a journey to try to measure aerodynamic drag yourself, but it’s worth asking if it’s truly necessary? Instead, you may achieve most of the gains by understanding the principles and investing in trustworthy brands.


The real-world challenge of cycling aerodynamics
Making practical use of aerodynamics is much more difficult due to its complex nature. Weight is simple, less is better and one can easily measure it at home. Rolling resistance is more difficult to assess, but again, less is better and so with some confidence, we can determine which are the fastest tires for road cycling. Aerodynamic drag, however, is complex and challenging to assess. Indeed, the most aero setup for the individual use case outside on the road is almost impossible to determine as many factors interplay. Still, some general principles will be discussed in the following sections.
What counts for aero in cycling is effective wind speed, not the ground speed shown on your computer
The standard for testing cycling equipment is typically based on wind speeds of around 40 to 45 km/h. However, many cyclists have criticized this, as the average cyclist rarely maintains such velocities, and if they do, it’s often only briefly. The focus might be misplaced on the wrong speed metric. It’s not about the speed at which you travel across the terrain but the effective wind speed you encounter. This means the speed with which you hit the air in front of you will be different because of, well, wind, the meteorological kind.
Testing wheels at 45 km/h is more realistic than it may seem. Don’t forget that the natural wind is added to the ground speed shown on the bike computer. 30 km/h can become 40 km/h and more quickly.
It is rare for the wind to be entirely still outside. Sometimes, there are just light breezes of a few kilometers per hour, while other times, you may find yourself struggling against powerful gusts of over 40 km/h and more. On average, most riders experience winds of around 10 to 20 km/h, which must be factored into their ground speed. For example, if you ride at 35 km/h with a 10 km/h headwind, your effective wind speed relevant for aerodynamics will be 45 km/h. Conversely, if you have a 10 km/h tailwind, your effective speed will be decreased to 25 km/h.
Admittedly, the values the industry tests are still on the higher side and most applicable to pro racing, yet maybe not that far away from the situations you will encounter on your bike. Still, what is faster at 45 km/h will also be faster at 30 km/h, just the difference will not be as pronounced.
The pesky cross-winds: how yaw affects cycling aerodynamics
The yaw angle of the wind on the rider is influenced by four key components: the rider’s speed and direction, along with the wind’s speed and direction. While riding, we not only feel the air we push aside as we move forward but also experience varying wind intensities from different directions. Both combine to create an effective wind at the frontal edge of our bikes. Even if it may feel as if the wind is always coming straight against us, that’s rarely the case.
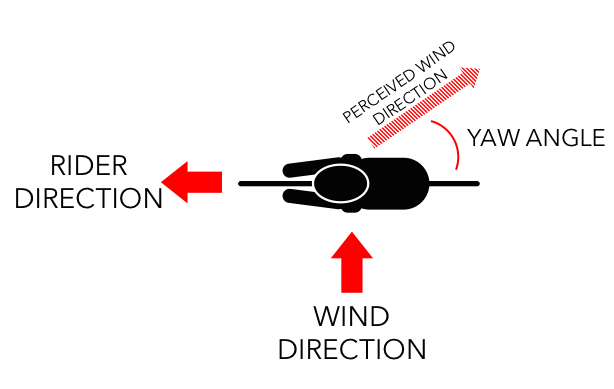
The yaw angle of the effective wind that cyclists usually experience ranges from 0 to 20 degrees at most cycling speeds. Generally, higher yaw angles greater than 10 degrees are much less common than those with lower angles. Additionally, as cyclists increase their speed, the yaw angle tends to decrease. Higher yaw angles can be good, as they help the so-called sailing effect by which deep section wheels or aerodynamic frames act like a sail and effectively push the rider forward.
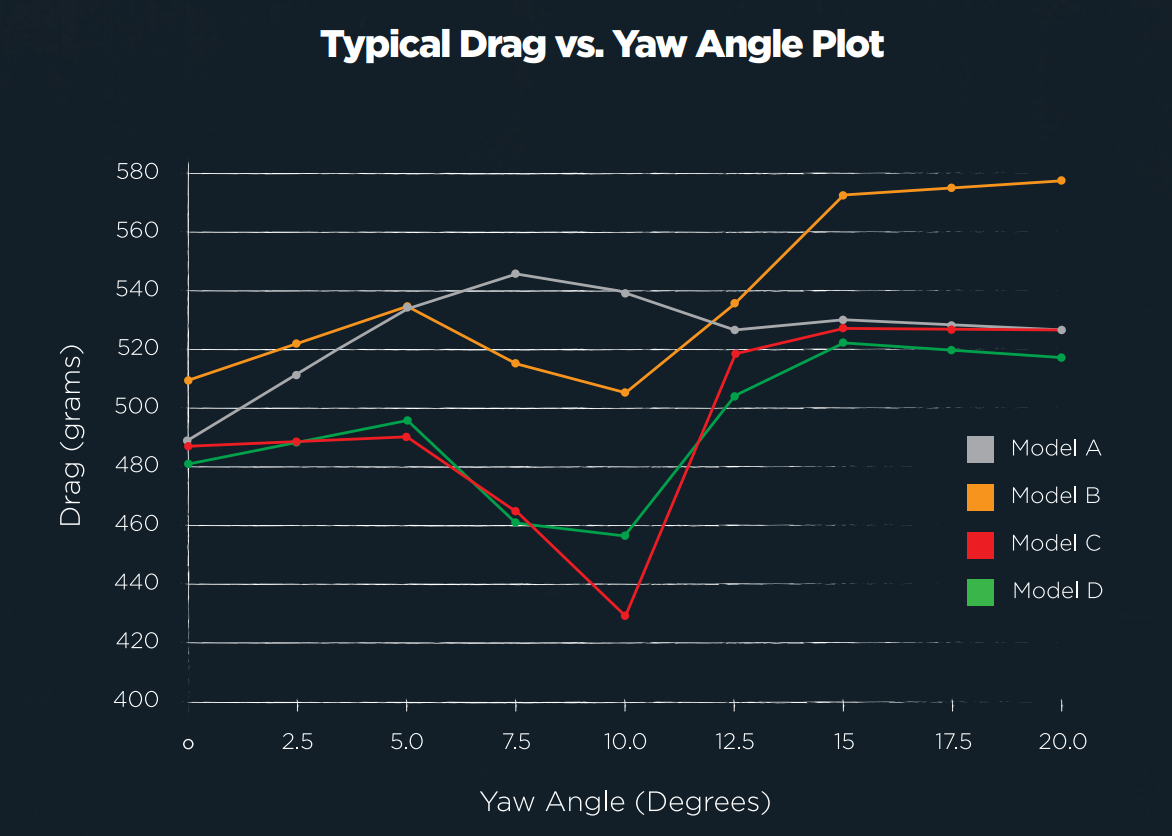
In aerodynamic testing, the yaw angle introduces an additional layer of complexity. Depending on the riding conditions and speeds, one rim may perform better than another due to varying yaw conditions. Again, “the fastest” is highly subjective and can vary based on these factors.
As one can easily observe in the graph above, yaw adds another level of complexity. Which is the best model? For example, Model C (red) and Model D (green) have a typical reduced aero drag at a yaw angle of about 10 degrees. On the contrary, at 0 degrees and above 12 degrees Model D (green) has the lowest drag. Most of us probably don’t know the yaw angles we typically encounter on our rides. Which model would you choose? You might lean towards Model C (red) or D (green). Deciding between the two is a close call and might not make a significant difference. Moreover, both makers can claim their model is “the fastest” based on how they share their data. One solution is using a weighted average based on typical ride conditions; however, currently, there is no comparable standard.
Navigating cross-winds: stability may trump speed in aero wheel design
Yaw gives us another point to consider: cross-wind stability. When the effective wind comes at a yaw angle against the front wheel, the rider experiences steering forces from the side. You may remember the feeling when a large truck passes you or the wind direction suddenly changes while passing a gap between some houses on the side of the road. This phenomenon is tricky and scary, mainly because it can appear suddenly without a warning. Therefore, most companies focus on cross-wind stability, especially since the early aero-bike wheel models were very unstable. The goal is to reduce the steering force by adopting a different shape and making the forces more predictable so the rider can react.
Aerodynamic wheel design has evolved significantly with cross-wind stability as a primary concern. Nowadays, a depth of 40-50mm is recognized for optimal balance between performance and safety during varying wind conditions.
Indeed, nowadays, the very deep aero wheels are gone from the pro peloton as teams value stability over a couple of watts saved. As a rule of thumb, around 40 to 50 mm depth is probably the sweet spot for general road riding.
From wind tunnel theories to winning races: it’s not just a tunnel vision
After our discussion so far, it’s clear that assessing aerodynamics is a challenging task in general. It’s even more challenging to determine the most suitable aerodynamic bike component for a specific rider and bike race scenario. In this section, we will discuss the process of aerodynamic testing. This information will assist you in understanding the claims made by equipment manufacturers and enable you to make more informed choices. It is important to note that comparing the testing data of different companies can be difficult due to varying experimental conditions.
The tools used to understand cycling aerodynamics are CFD, wind tunnels, and velodrome testing.
Nowadays, engineers have primarily three ways at hand to understand the aerodynamics of cycling components: computational fluid dynamics (CFD), wind tunnel and real-world testing in a velodrome or outside.
CFD, short for computational fluid dynamics, is a software-based simulation to predict how air flows around components. It requires expensive software and an accurate physical model of the part being assessed. Engineers can test multiple configurations and make informed design decisions as the entire process is executed on a computer. There are limitations, as fully modeling a moving, rotating bike wheel is very difficult and a complete bike has many moving components, not least the rider. As such, the technology is helpful, especially in the development of new bikes and parts, to steer the engineering in the right direction.

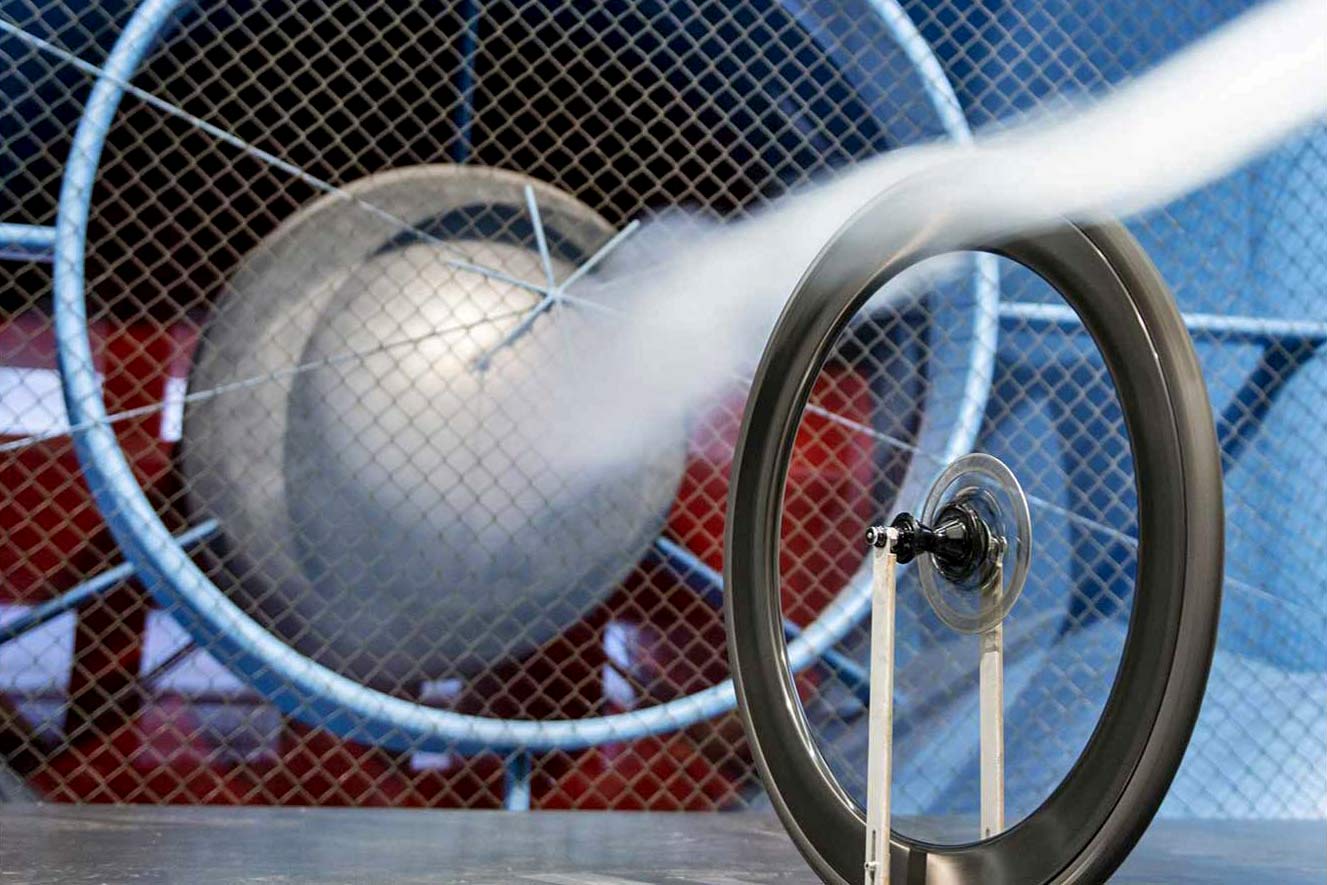
A wind tunnel is the laboratory of the aerodynamicist to simulate the effects of air resistance on an object moving through the air. It is a tube with powerful fans that draw a consistent wind flow over a fixed object under test, such as a bicycle or other components. Additionally, researchers can visualize airflow over a test subject by studying the movement of smoke or dye as it passes over the object. When the airflow changes from laminar to turbulent, it indicates that the airflow has become separated at certain points.
Various factors such as drag, side forces, real-time air temperature, and wind speed can be measured within the wind tunnel. The tunnel’s flow, direction, and wind speed can be controlled independently of the weather outside. For the bike industry, the challenge is that the wind speeds in question are relatively low compared to other industries such as Formula 1. As such, the wind tunnel must be built with high precision and sensitive machinery, greatly increasing operational costs.
The next step of a controlled environment is the velodrome, which is often employed, especially when optimizing the rider’s position and equipment choices. It is less controlled but a step towards the “real world,” where testing becomes very difficult since the environment can not be controlled and many confounders preside.
How challenging the task becomes will be more apparent once we try a little thought experiment of our own.
Thought experiment: How to assess the aerodynamic drag of a bike wheel in a wind tunnel
Imagine you aim to evaluate the aerodynamic drag of a new wheelset. How would you set up the experiment within a wind tunnel?
- Test only the rim? That omits the spokes, which is not realistic. But maybe it’s best to optimize rim shape?
- Add the spokes? Good, but should the wheel be static or rotating while you measure? Would the fork and bike not influence the aero data measured?
- Include wheel rotating, mounted on a bike? Well, is that realistic? What about the rider?
- Include wheel rotating on a complete bike with a dummy as a rider? Well, but the dummy is not pedaling. Would that not influence the outcome?
- Test wheel with a bike and a person riding atop the bike? At this point, are we still measuring the drag of the wheel or of all the other things?
Not easy.
As the scientists and engineers among you will have known already, every experimental setup has its own advantages and disadvantages, and the choice depends on the research question and the desired outcome. However, we need to consider how much information we get about the wheel when adding more variables to make the setup more “realistic.” At some point, we learn nothing about the wheel from all the other noise.
Yes, I am sorry, it’s complicated. Luckily, most of us are not designing new equipment; we just looking to purchase some.
Aero testing requires a lot of dedication, even with the latest high-tech gadgets
If you are looking into purchasing the most aero equipment for your budget, you have two possibilities. The first is to understand the principles of aerodynamics in cycling, assume the differences at the very top are minimal, and buy from a trusted brand. Very likely, you will enjoy most of the benefits the best aero equipment has to offer. You made a good choice and this blog is here to help you make that choice with all the articles in the Go Faster, Roll Faster, Be Faster categories.
However, if you want to fully comprehend the influence of each equipment choice on your personal aerodynamics, there is no way around testing yourself and determining your own CDA. Indeed, some things that are commonly known to be faster may not be in your particular case. Beware, this will involve learning how to use the testing equipment, have a good experimental setup and interpret the data. For those who are members of The Escape Collective, I can highly recommend the Performance Process podcast episode “Aero 101” to get a first insight into what is involved.
The Chung method enabled aero self-testing in the real world
Without a wind tunnel, there is a method to test aerodynamics out on the road, which is commonly known as the Chung method, invented by Robert Chung. In essence, you need to be riding several times at constant power on a closed loop or out and back, all while recording power, speed and environmental data such as wind and air density. You then take this data into software such as Golden Cheetah or Aerotune and mathematically determine your CDA. Aerotune explains the process in brief in the video below.
What makes this endeavor challenging are all the little interferences that affect the aerodynamics: changes in wind speed, rolling resistance, the position of the rider, weight changes of the rider, temperature, humidity and accuracy of all the equipment. As such, course selection is very critical. You need to be able to hold position and have minimum interference from passing vehicles.
Xavier Disley of Aerocoach highlighted especially the challenge of variations in rolling resistance on the Silca marginal gains podcast when testing for CDA. As we are currently not able to measure the rolling resistance changes of the road reliably, it adds consequential variability to the data.
Every single influence factor can change during the experiment, and if not accounted for properly, the result becomes less accurate. Ultimately, the calculated CDA value is only as precise as the least accurate measurement. The question remains: what is accurate enough for your testing goal?
Aerometers are a great idea but still have limited actionable use
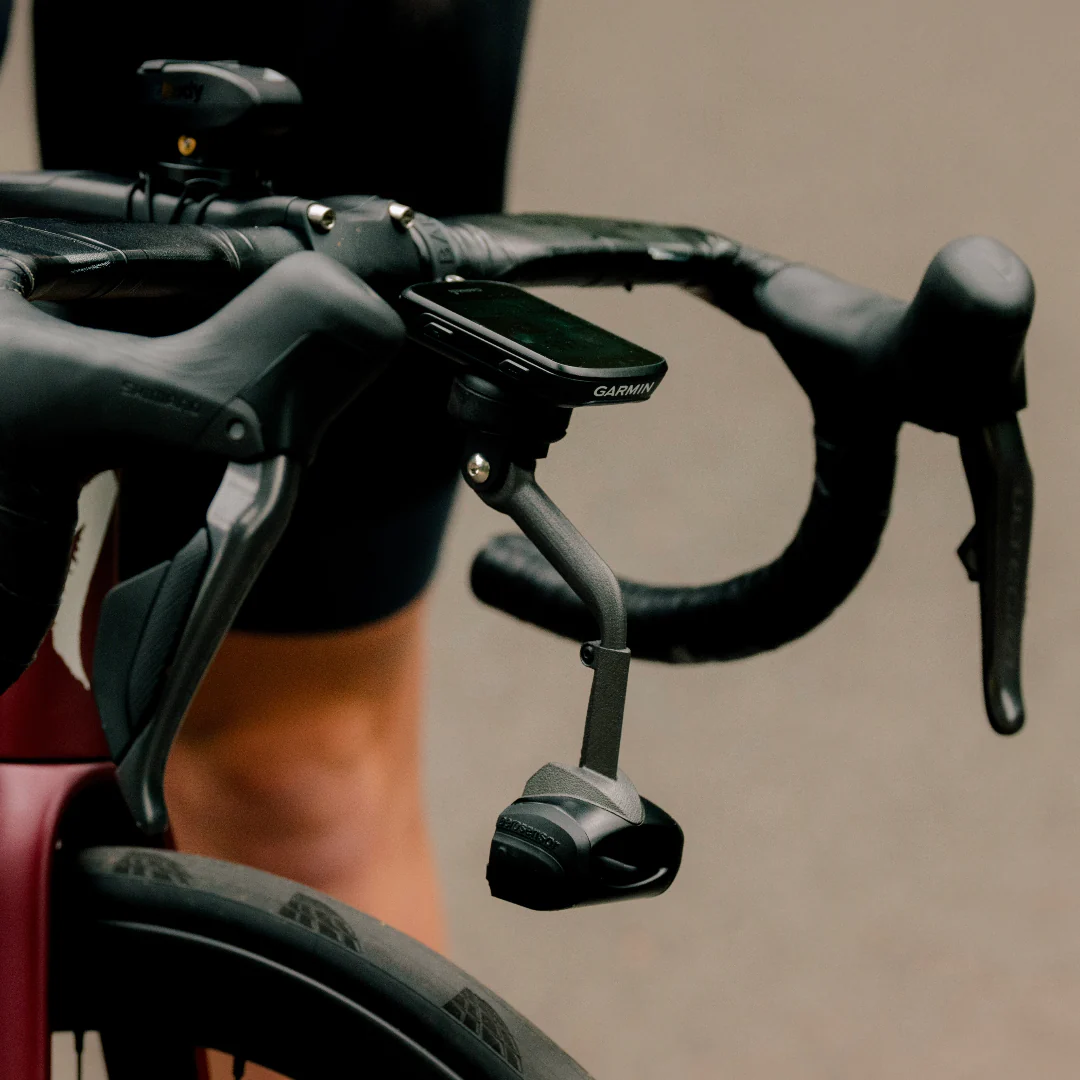
Some companies have started developing aerometers to simplify aerodynamic testing in the real world and measure drag more accurately. Most notably, Notio, one of the first and Aerosensor, one of the most popular these days. The aerometers measure dynamic pressure change and integrate with your power meter and speed sensor. Additionally, some devices detect changes in your position on the bike, such as the Forma Body Position sensor or the Aerosensor Aerobody.
For now, it seems that with these devices and methods, you may be able to understand your personal setup around more considerable differences such as position, aero vs. non-aero helmet or the effect of aero socks. But it will involve dedication and effort. Is it worth it? It is for you to judge. Maybe it’s best to book the services of dedicated aero testing and consulting firms such as Aerocoach, Swiss Side or Watt Shop.
 Made me Slower
 Same, Same
 Made me Faster