
For many of us, the biggest obstacle to becoming the fastest version of ourselves is not the training itself but recovery. We lead busy lives, and the challenge is to find the right balance in training intensity to get faster – more scientifically known as supercompensation. Devices like Garmin watches and The Whoop are designed to assist with this by collecting and presenting a wealth of data to help you make informed training and recovery decisions. In this article, we will explore the goals, software details, and hardware features of the Garmin Instinct watch in comparison to the Whoop. Ultimately, we uncover a surprising yet simple truth: keep it simple and focus on action.


Rest Makes You Faster by Supercompensation
Contrary to our ordinary perception, it’s actually rest that makes you faster, not training. Initially, training will make you slower. Surprising, right? When you engage in physical activity, you’re putting stress on your body, which can weaken it temporarily. After a tough training session, it’s no wonder you feel tired. What you’re really aiming for is your body’s response to this stress: a combination of hormonal and immune reactions that help rebuild your muscles, ultimately making you stronger and faster on the bike. This entire process is known as supercompensation.

The chart above illustrates three common scenarios related to training. Ideally, you should combine an appropriate training stimulus with adequate rest, allowing your body to strengthen over time. This is represented by the green scenario, where your body experiences positive supercompensation. However, a shift into the red or yellow scenarios often occurs. Due to excessive stress, the balance between training and recovery becomes skewed, which ultimately leads to overtraining or minimal progress.
Most of us do not get faster because of insufficient recovery
Finding the right balance between training stress and recovery can be challenging for most of us who want to ride our race bikes as fast as possible but aren’t full-time professionals. Often, the main issue is insufficient recovery. While indoor interval sessions and fast group rides can provide a significant training stimulus (though it may not always be the most effective), we frequently struggle to recover adequately. This can be due to various factors, such as general stress from our daily lives, not getting enough rest and sleep, or a combination of everything. I am sure you all have been there.
Focusing on recovery will likely have more impact than having a perfectly optimized training plan for most cyclists who aren’t full-time professionals. Devices like Garmin watches or Whoop can help you to achieve just that.
What ultimately makes us faster likely lies less in having a perfectly optimized training plan and more in maximizing our recovery. This is where wearable devices, like Garmin watches and the Whoop strap, come into play. They analyze our bodies and help us make informed decisions about our training and recovery. In the following paragraphs, I will compare the functionality of the Garmin Instinct Crossover watch and the Whoop strap as I wore both devices simultaneously. Although I only had the Garmin Instinct model, it can be assumed to operate similarly to other Garmin models, such as the Forerunner or Fenix series.
Before we proceed, it’s important to emphasize that having a solid training plan and knowledge is extremely valuable. However, there are more effective resources available than this blog. By subscribing to Faster Bike Blog, you will immediately receive my top three training advice resources. Just check the bottom of the post.
What do we want from a recovery device?
It’s actually funny. Initially, it sounds simple: I want a device that helps me recover. Yet, what does this actually mean? To be honest, the more I researched all these devices in detail, the more lost I became.
I came to the realization that I needed to define my goals for these devices and what I wanted to achieve with them. As athletes, we often have ambitious aspirations, but our minds can sometimes push us beyond what’s beneficial. Additionally, those of us with full-time jobs, families, or other significant commitments often underestimate the impact these factors have on our recovery. Therefore, having a device that guides us in this area can be helpful. However, I am not looking for detailed training advice; I still believe that coaches or specialized apps are better suited.
What I am looking for in a recovery device is a simple answer to the following questions:
- Should I train today or tomorrow?
- How should I train? Is it easy, or can I go hard?
- What limits my ability to recover? Where can I improve?
- Is there something going on in my body that I should be listening to? For example, unusual amounts of stress or an illness.
This article is written with those objectives in mind. Additionally, I assume you can determine the usage of the devices yourself; this focuses more on utilizing the functionality.
Optimize Your Recovery with Whoop And Garmin
Garmin and Whoop may be the most well-known and used wearables in the cycling world. Both rely on an optical sensor that tracks metrics of heart rate, sleep, and other related parameters through the skin. Both can be worn simply on the wrist. Their integration with cycling has been particularly impactful, as endurance athletes rely heavily on recovery and strain balance.
Garmin is the leading sports brand and offers a complete ecosystem with the Garmin Edge bike computers and a series of different watches, such as the Garmin Forerunner, Fenix, and Instinct Series. Although the models differ, the functionality for tracking wellness and recovery is essentially the same.
Whoop, founded in 2012, initially targeted elite athletes with its flagship product, the Whoop Strap, a simple device without a display worn on the wrist. Via its app, it provides insights, helping athletes optimize their training regimens and prevent overtraining. In comparison to Garmin watches, which have many additional features, the Whoop Strap is mostly focused on optimizing recovery.
For this article, I am looking into a Whoop 4.0 and a Garmin Instinct Crossover. I paid for both devices, and neither company sponsored me.
Whoop and Garmin can both help you with your recovery
Both devices are worn on the wrist and use an optical sensor to measure your body’s health data, but this is where their similarities end. Garmin watches are designed as full-fledged smart devices with a strong focus on sports and training. They include a variety of features, such as specialized functions for diving, military use, and even some high-end luxury models. For the purpose of this article, however, we will concentrate on the training and recovery functions, which are comparable to those of the Whoop.
The Whoop is a wrist-worn device without any display, solely focused on measuring your body and showing all data on the app. There is no display. It caught my interest because I kinda liked the idea of wearing a classic watch again while still having all the smart watch features. The pricing model for this device is different from what you might expect. It cannot be purchased outright; instead, it is only available through a relatively expensive subscription that includes the device itself.
Be aware that Whoop may try to entice you into a minimum annual subscription, even if they advertise “Monthly Payments.” If you decide to cancel, you will not only have to pay for the entire year, but they also require payment upfront. I’m unsure if this practice is legal outside the U.S., and it likely wouldn’t be permitted in Europe.
The WHOOP subscription model only benefits the company. While the pricing is similar to other devices, it restricts users from reselling or engaging in the second-hand market. Additionally, their strategy of requiring a minimum annual subscription and complicating the cancellation process is questionable at the very least.
Furthermore, there’s no assurance regarding how frequently new devices will be released. The current version, 4.0, was launched in 2021, and rumors suggest that version 5.0 will come out in 2025. This gap is significant, especially considering that the earlier release cycle was approximately two years. The first Whoop device was introduced in 2015, followed by version 2.0 in 2017 and version 3.0 in 2019.
The Software: Diving into the Data of Garmin and the Whoop
Both devices measure similar data, primarily based on the information gathered from an optical heart rate sensor on your skin. Therefore, the value for the user and the distinction between the two devices largely come from the software aspect. This is where data integration and interpretation occur, helping us make informed decisions.
Basic health parameters are measured reliably by Garmin and Whoop
A Warning upfront: The many different parameters make it reasonably hard to know what to focus on. In my experience and testing with both devices, they produce comparable data and quality. While the measurements are not identical, both devices consistently capture raw data reliably, given the limitations of optical sensors. Throughout my testing period, I did not find any significant differences between the two, as detailed below.
- Heart rate (HR): This is the number of times your heart beats per minute. It is highly individual. A higher heart rate correlates with intensity and stress. Generally, that number is around 100 to 200 when doing some kind of activity.
- Resting heart rate (RHR): The average heart rate at complete rest is a key indicator of overall fitness. In the past, athletes measured this rate right after waking up, but nowadays, devices can automatically track it throughout the night. While the range of the values varies from person to person, a relatively lower resting heart rate generally suggests less stress, whether from training, illness, or typical mental pressures. Typically, well-trained endurance athletes have resting heart rates below 50 beats per minute.
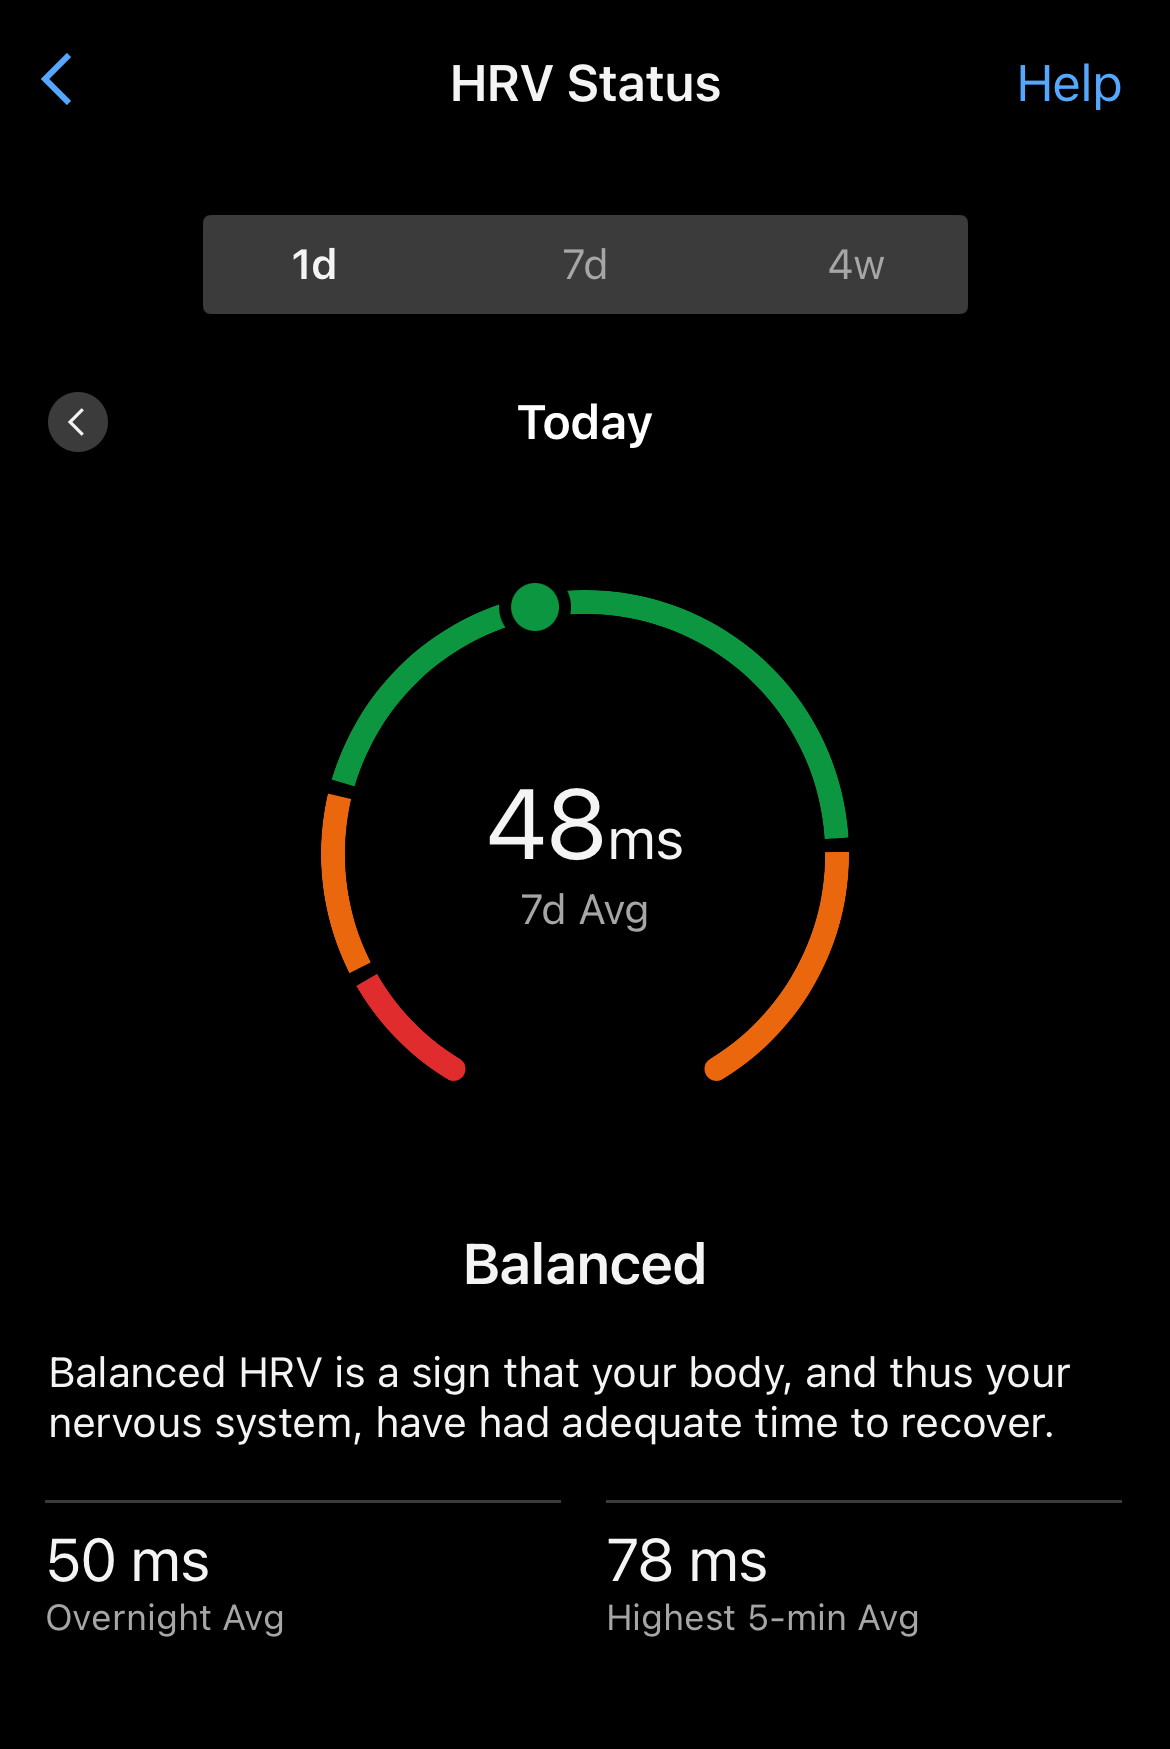
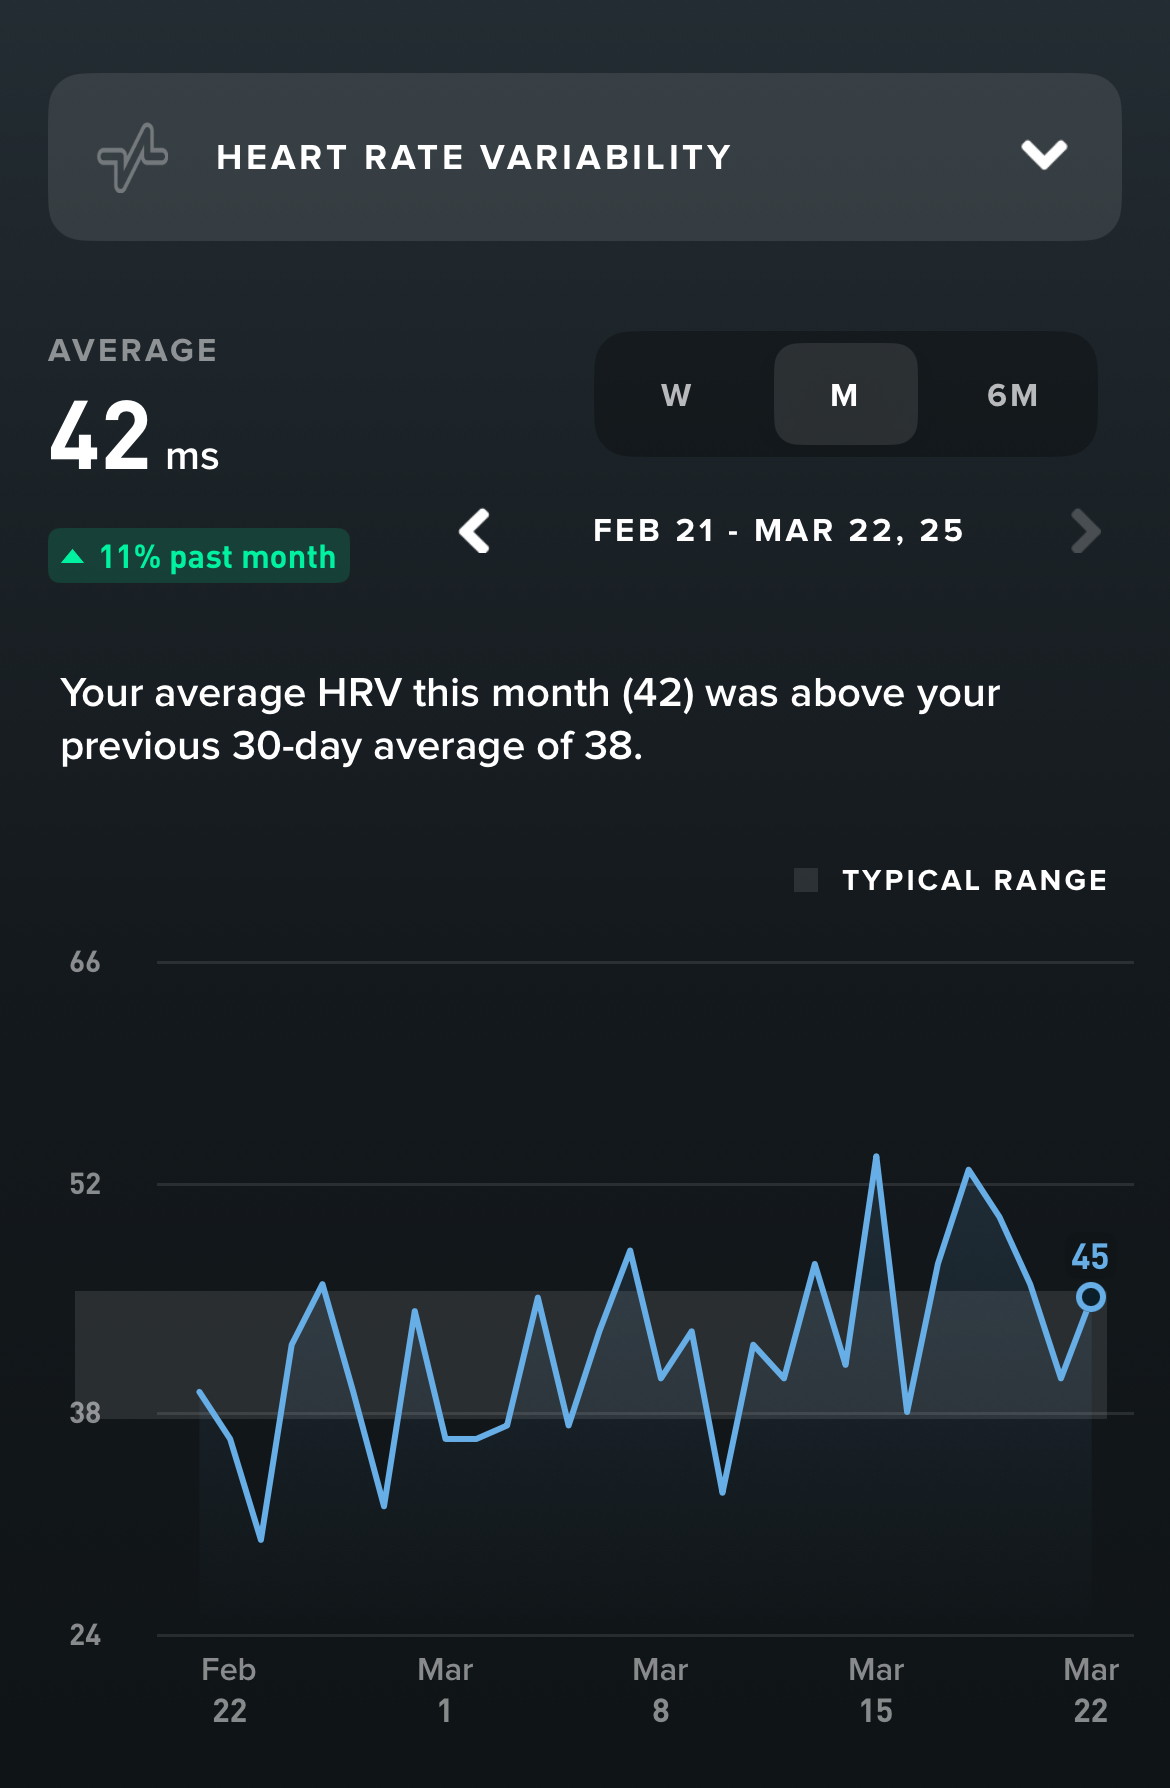
- Heart Rate Variability (HRV): This is the variance between each heartbeat, measured while one is asleep. Again, it is very individual, but based on the personal range, a higher value or more variability indicates a more rested state. In comparison, a lower value indicates a more stressed state. This is opposite to resting heart rate, where lower values suggest less stress.
- Respiratory Rate (RR): Similar to the other parameters, it measures breaths per minute, which should be stable for each individual. If not, changes like illness, allergies, or sleeping at altitude may have occurred.
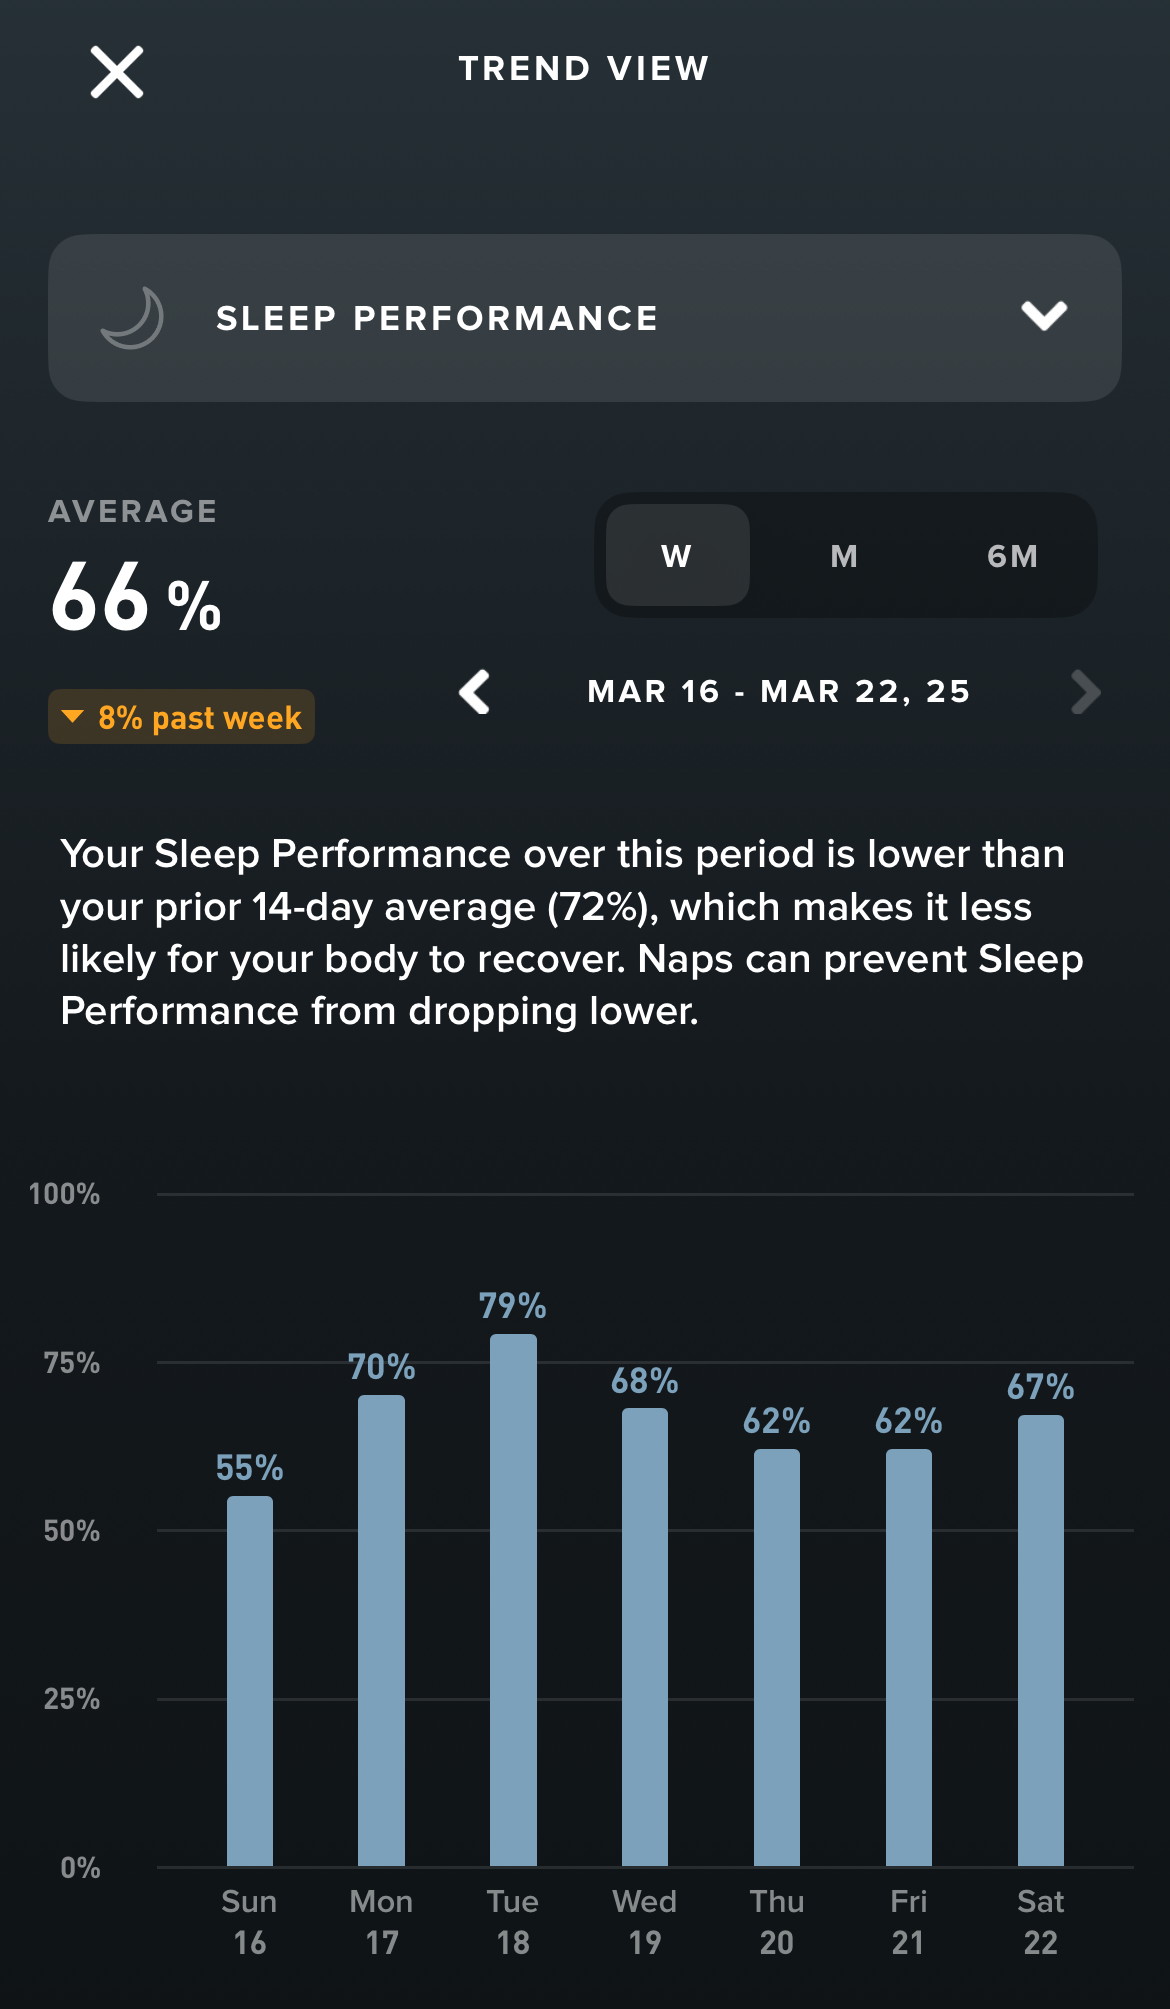
- Sleep Duration: Perhaps most importantly, both devices attempt to measure the duration and quality of sleep. Of course, the longer and better you sleep, the better your recovery.
Basic combination parameters around Stress and Sleep Quality aim to provide more straightforward Insights
There are also combination parameters, which are interpretations and calculations of previous parameters.
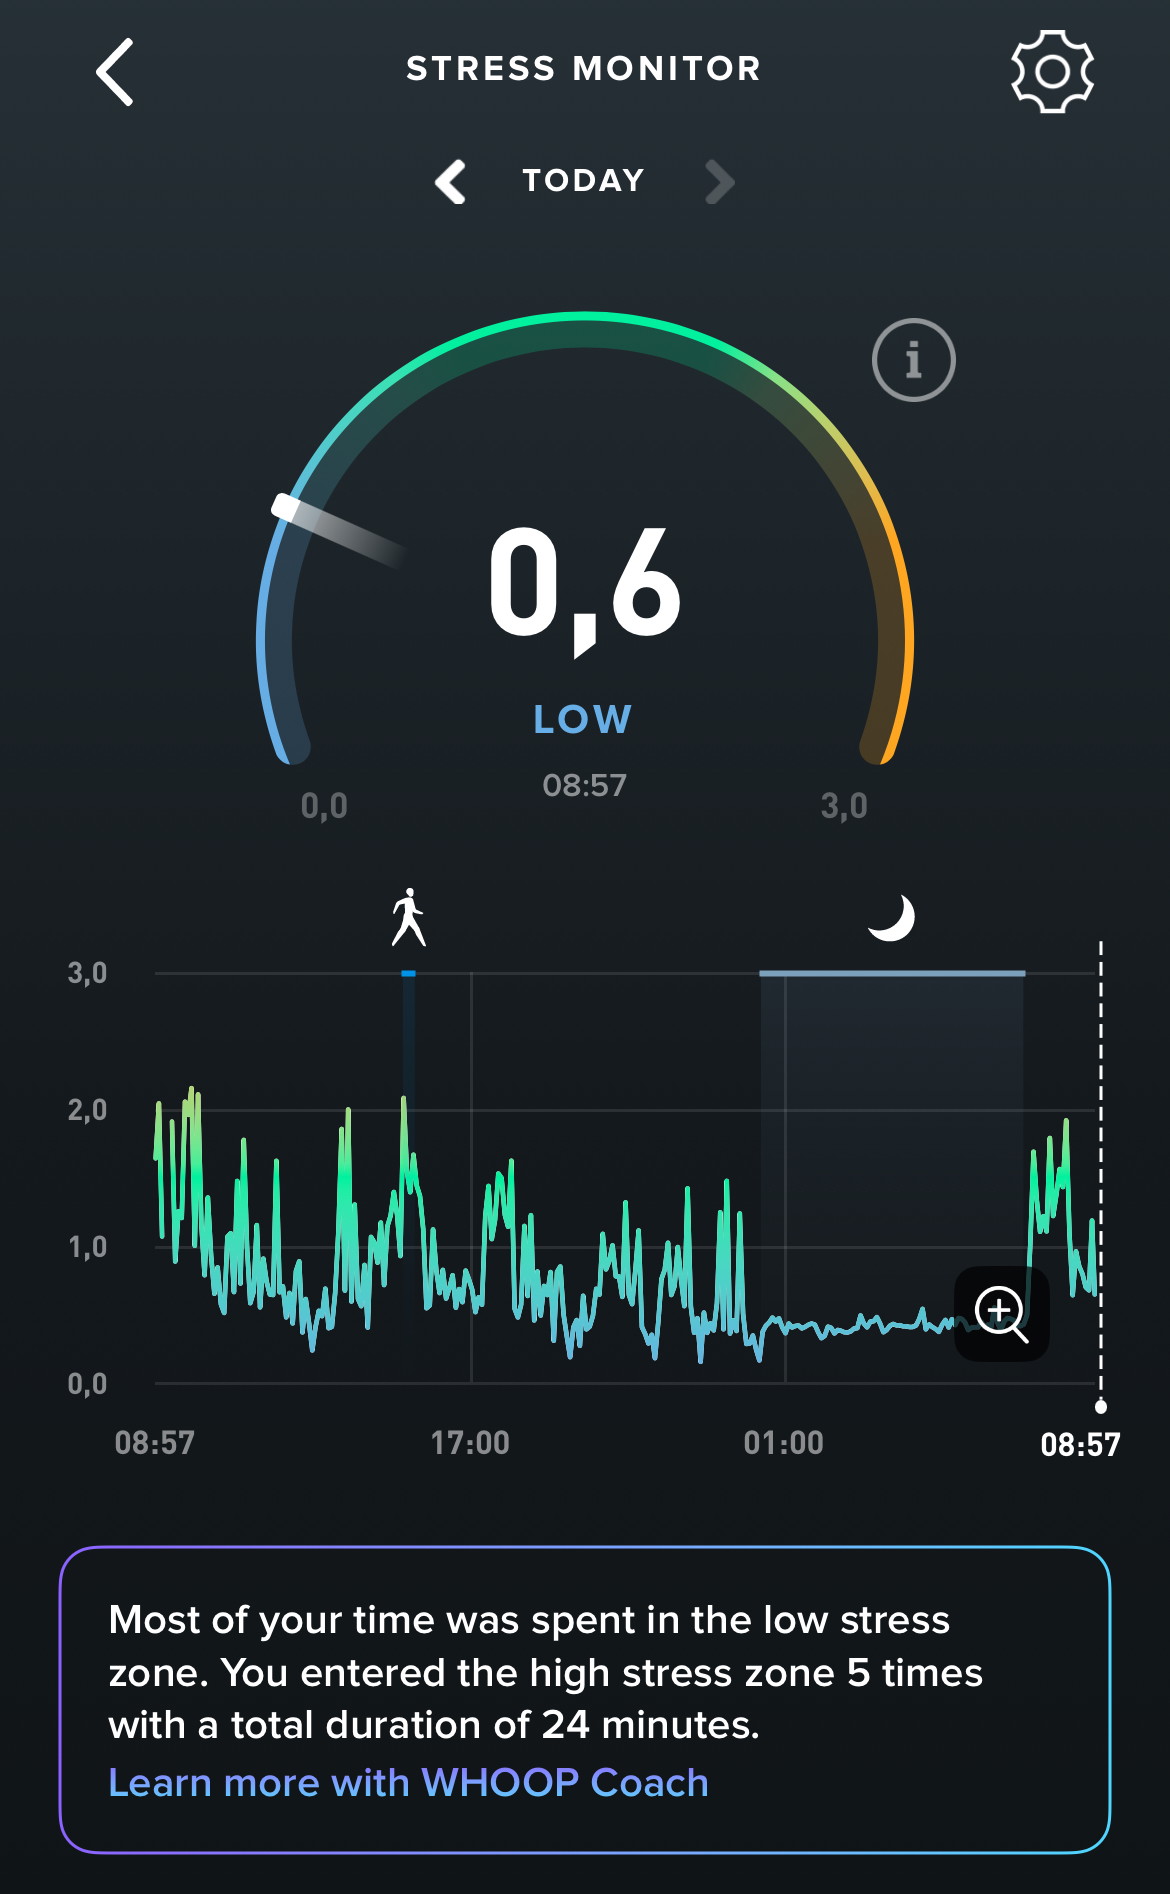
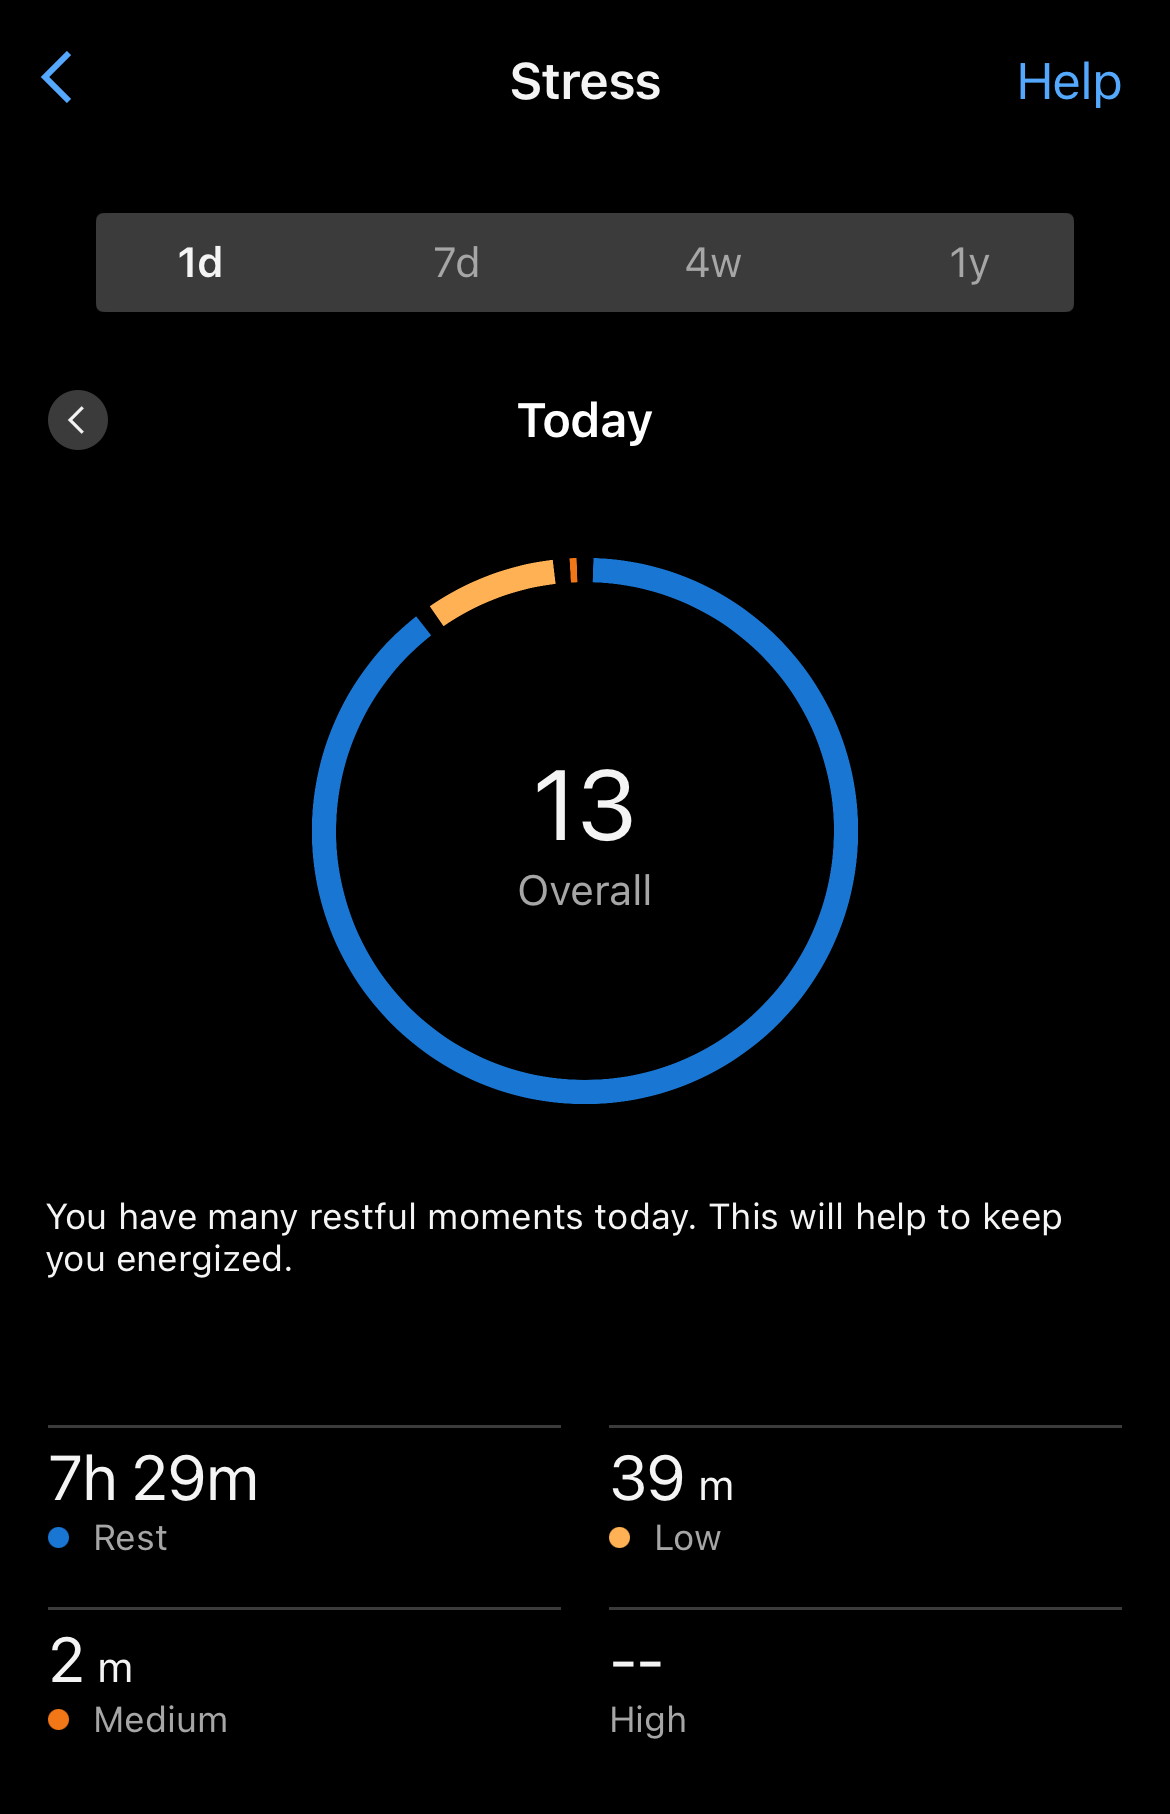
- Stress: This measures how alert and activated you are, which is inferred from the current heart rate (HR) and heart rate variability (HRV). Stress can be good when needed, like being alert and „On“ during an activity. Stress is bad when it is still there when you should be relaxed, especially during sleep. It is one of the significant challenges for most amateurs, as we are much more stressed beyond our training, which impacts our ability to recover. Whoop has a score from 1 to 3, where lower is less stress, and Garmin uses a score from 0 to 100, where above 50 is more stressed.
- Sleep Quality: Garmin and Whoop attempt to gather insights into sleep quality, looking beyond simple durations. This involves assessing periods of deep sleep, REM sleep, stress during sleep, and some measure of consistency.
All these different parameters can quickly lead to data overload, making it difficult to understand the questions you are trying to answer regarding your recovery.
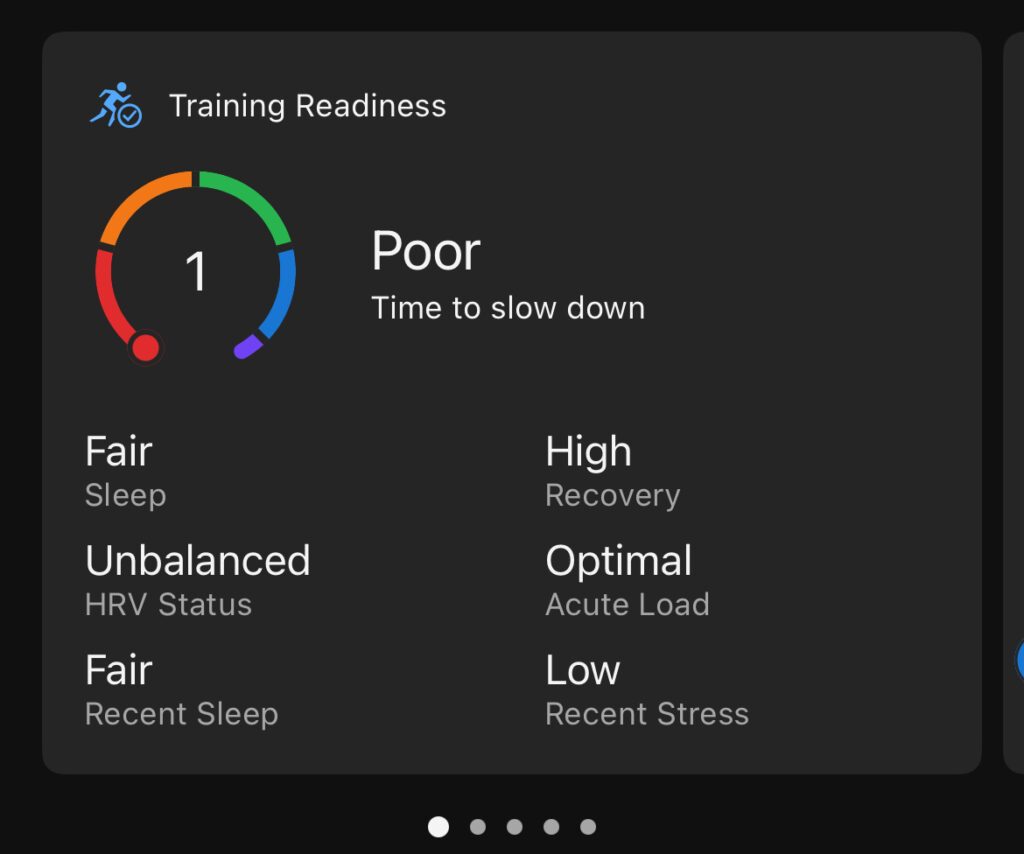
Garmin provides intuitive metrics: Training Readiness Score and Body Battery
The most intuitive metric provided by Garmin is the Training Readiness Score. This score aggregates several factors, including your sleep score (which indicates how well you slept), the required recovery time (calculated based on your previous efforts), HRV status, acute load (based on past activities), recent sleep scores, and recent stress levels. The main advantage of this score is its simplicity and ease of understanding. However, from a scientific perspective, combining various data points into a single score can be misleading as it doesn’t necessarily improve the accuracy of the information. In my experience, I found that the Training Readiness Score did not always accurately reflect how I felt or how I believed I should train.
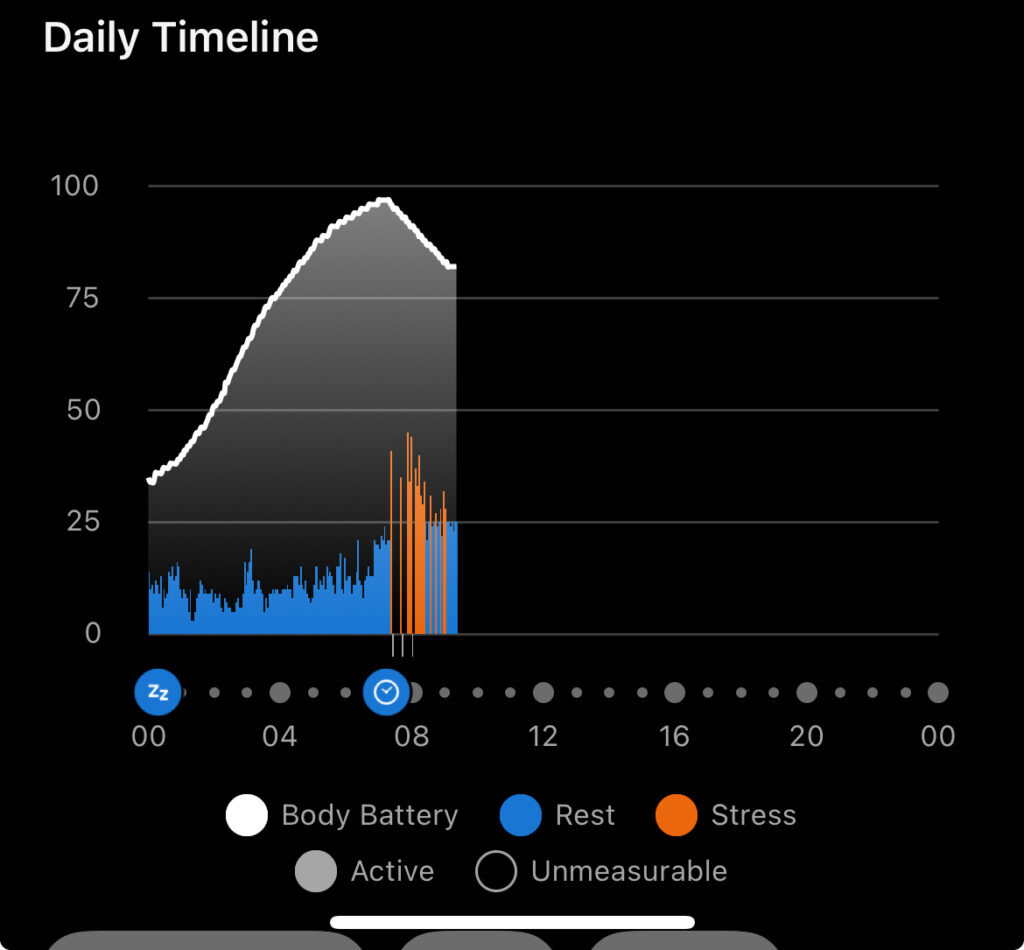
Another indicator with similar intentions is Body Battery. As the name suggests, it aims to show you how much “charge” you have left. Body Battery increases during recovery phases, particularly during sleep, reaching a maximum level of 100. Conversely, it decreases with physical activity and stress. It’s an interesting metric to observe and can help you gauge the training you should target. However, in practice, it becomes less clear what to aim for when your scores are around 50.
Finally, there is the Training Status parameter, which is intended to indicate whether your training is productive, maintaining, or possibly overreaching. To be honest, I haven’t found this black box parameter very useful. The results haven’t helped me make decisions about my next steps. Interestingly, the internet is filled with memes about it.
The Whoop focuses on coaching guided by Strain and Recovery
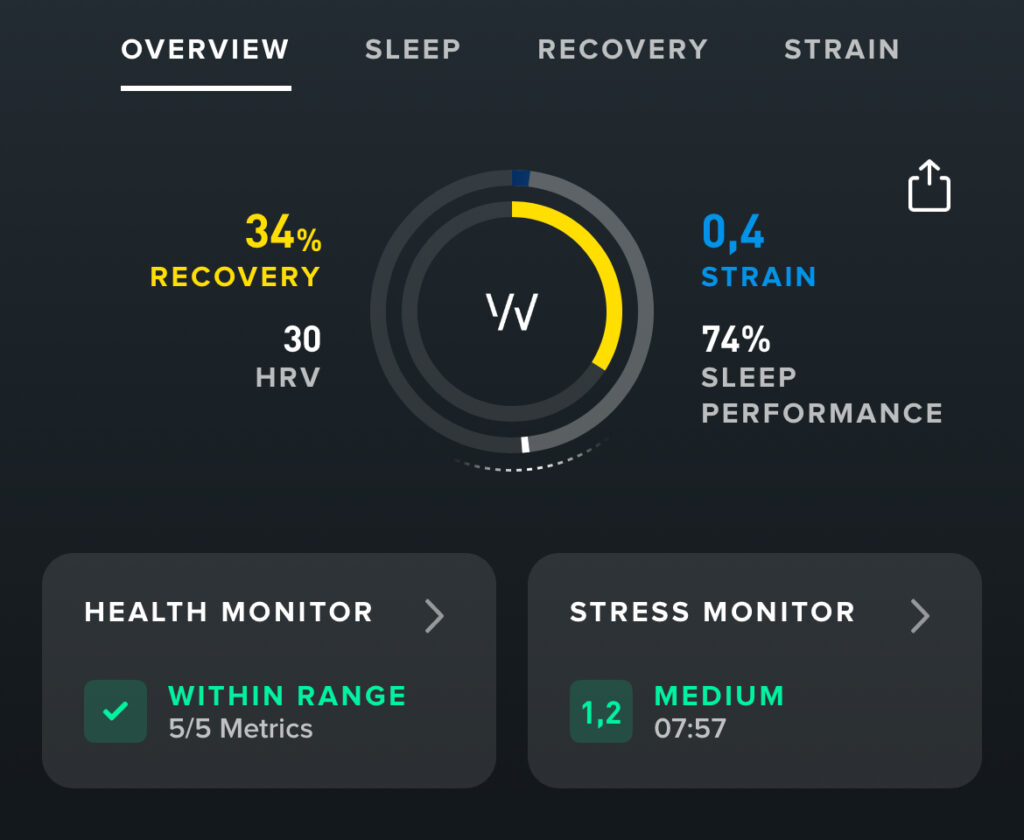
As a device solely focused on optimal recovery, the Whoop has much more than just data; it tries to make a complete coaching experience, aided by an AI Coach, which is surprisingly quite helpful. The main graph and system are based around two propriatry parameters: Recovery and Strain.
Recovery measures how well your body adapts to physical, mental, and emotional stress. It is calculated using factors such as heart rate variability (HRV), resting heart rate (RHR), respiratory rate, and sleep quality. A recovery value above 67% indicates that you are fully recovered, while a value below 33% suggests that you are strained. Strain, on the other hand, refers to the amount of exertion you’ve put on your body. It is measured on a scale from 0 to 21, and it’s important to note that this scale is logarithmic, meaning that each increment becomes increasingly challenging. Consequently, you can reach a score between 0 and 9 relatively quickly, but achieving a score above 18 on difficult days is quite hard.
In practice, both parameters are not particularly useful on their own. Most of you can tell when your strain level is high because you feel it during or after the workout. Additionally, the recovery composite score doesn’t provide much more insight than simply looking at your Resting Heart Rate or a similar metric.
However, one helpful aspect is the calculated strain target for each day, which indicates an optimal range of strain to maximize performance without risking overtraining. The Whoop can notify you when you’ve achieved this target for the day, and I found this feature to be a helpful general guide based on my training goals. For instance, if I planned a low-intensity day and received a notification from Whoop, it signaled that it might be wise to stop my workout earlier. Conversely, on days when I intended to push myself, I would often disregard the target. Interestingly, after completing those harder workouts, the feedback from Whoop was usually congratulatory, reinforcing that those challenging sessions contributed to my strength.
Journaling and AI Coach are outstanding features of The Whoop
Whoop has understood that simply showing some metrics will not be enough for the athlete to make informed decisions for their training and recovery. To compensate, they have added two features that have been well implemented.
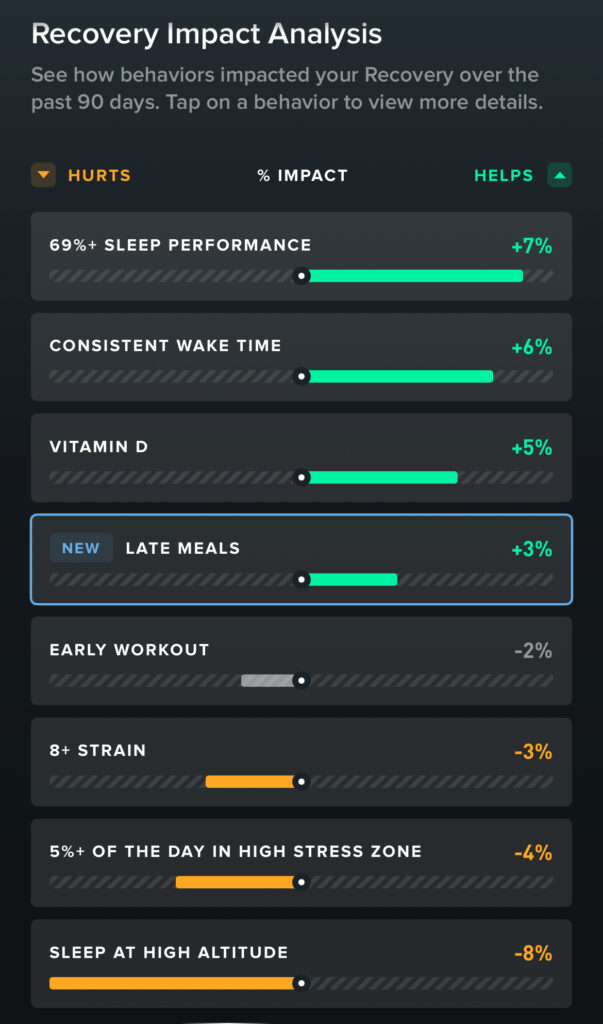
The journal is a standout feature, designed to help athletes understand how their daily habits impact their performance, recovery, and sleep. By logging behaviors like alcohol consumption, caffeine intake, meal timing, meditation and medication, athletes can track how these choices influence key metrics such as recovery scores, sleep quality, and strain levels. Over time, WHOOP analyzes this data to provide personalized insights, revealing patterns and correlations that can guide better decision-making.
The team at WHOOP recognized that merely presenting athletes with data is insufficient. To enhance the coaching experience, they introduced a simple journaling feature along with an AI coach. This approach aims to encourage athletes to adopt optimal behaviors based on the insights derived from their data.
What makes the journal particularly powerful is its customization. You can tailor it to track behaviors most relevant to your lifestyle and goals, ensuring that the insights you gain are meaningful and actionable, focusing on what matters to you. However, it’s important to remember that correlation does not imply causation. For instance, the screenshot below shows that late meals are correlated with better recovery. This is likely an artifact of the data. At one point, it even suggested that alcohol consumption was likewise associated with better recovery! Interestingly, in my case, vitamin D consistently correlated with better recovery. Since my vitamin D levels are relatively low, this serves as a great reminder to pay more attention to it. Overall, the Journal is probably the simplest yet most powerful feature of the Whoop.
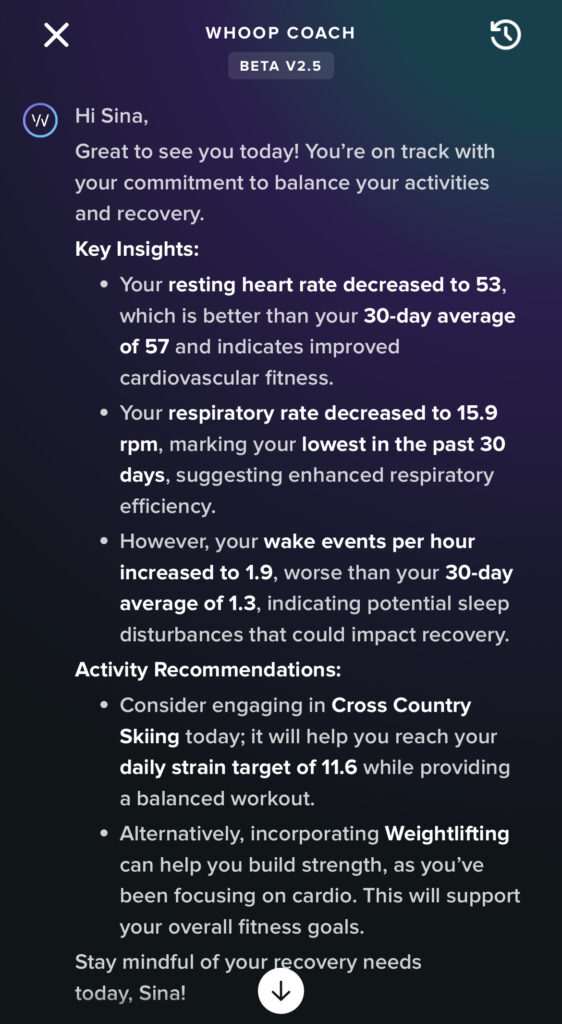
In contrast to the simplicity of the Journal stands the AI Coach feature. Honestly, I’m not a fan of the current trend of “AI everything” in apps, but I must admit that Whoop has implemented this feature well. Essentially, the AI Coach summarizes your current state for the day in natural language and provides concrete training recommendations that are pretty helpful. While I would not follow them literally, they are still handy hints. Additionally, the AI Coach effectively explains the app’s features and general concepts. Overall, it has been a pleasant surprise and is a valuable supplement to the Whoop experience.
The Hardware: Wearing the Garmin and the Whoop
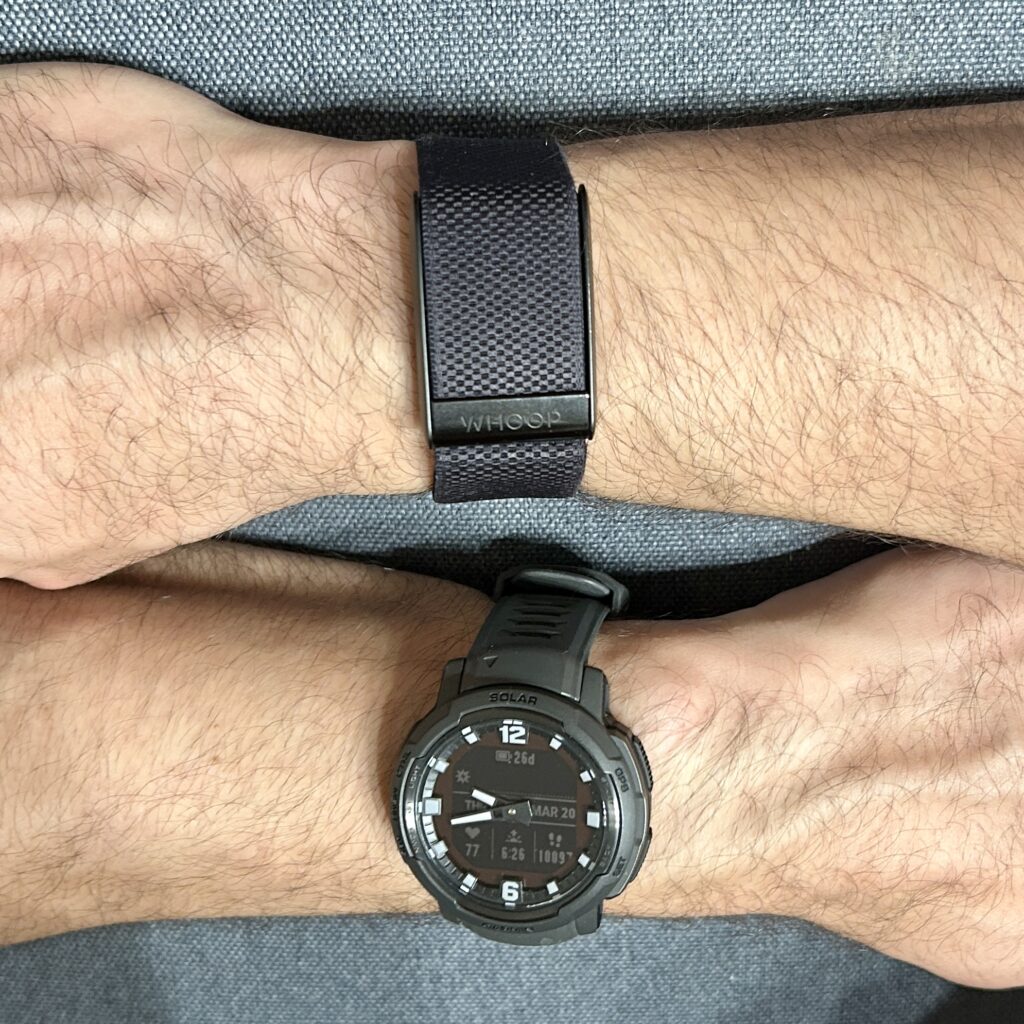
For this comparison, I wore the Garmin Instinct Crossover on my left wrist and the Whoop on my right wrist for a couple of months. Aside from the obvious distinction that the Garmin is a smartwatch and the Whoop is merely a tracking device, a few differences became apparent during this time.
First difference: comfort. Although the Whoop device is slightly curved and smaller than the Garmin watch, its clamp mechanism and strap quality feel cheap. The strap is not easily adjustable and is generally uncomfortable, especially when wet. In contrast, the Garmin watch features a high-quality silicone strap that is much more comfortable. While Whoop does offer additional straps, including some designed for the bicep, they come at a high price, and none of the options seem to have exceptional ratings based on what I’ve seen in their store. They also offer underwear with a slot for the device. While I appreciate the concept, I am not eager to purchase all my underwear from Whoop just to accommodate the device, especially considering how much underwear an active person typically needs.
The WHOOP’s biggest weakness is the cheap clamp and strap design. Maybe the expensive extra ones are better, but this should be part of the standard package if they really intend to provide a premium experience that justifies the high monthly subscription costs.
One key difference between the devices is the method of charging. Garmin uses a proprietary charging port, which is technically impressive since it operates without protection, allowing you to take your watch even into saltwater. However, this means you must always have the specific Garmin cable or at least an adapter on hand. Finding a replacement can be difficult if you forget it while on vacation. Garmin’s solar-powered system significantly extends battery life, especially in the Garmin Instinct series, which benefits from a simple display that conserves energy. However, you must remove the watch to charge it for a while.
Whoop has introduced an innovative battery pack that slides over the device, allowing you to charge it while wearing it. While this concept sounds appealing, it comes with the downside of remembering to bring the battery pack along and keep it charged. I’ve forgotten it a few times on short trips and even misplaced it once. Since the battery pack isn’t available in stores, I ran out of charge on my Whoop. This made the advantage of having an “always on your body” device seem pointless.
Additionally, the battery pack doesn’t hold its charge well (and Whoop support wasn’t helpful), so I always had to charge the pack before sliding it onto the Whoop. Finally, the charging process is relatively slow, taking a couple of hours—much longer than charging the Garmin Instinct. Overall, I’m not convinced that all this hassle is justified for the ability to track my data continuously. Losing an hour here and there every few days doesn’t significantly impact the overall picture.
The WHOOP’s “always on your body, never on your charger” design is only exciting at first glance. Now, you have to keep track of a battery pack, charge it, and, most importantly, always bring it along. Frankly, it doesn’t really matter for the quality of the collected data if the device is charging for an hour every now and then.
Garmin Instinct and Whoop 4.0 both measure data accurately
It is crucial that the raw data collected is of high quality, especially given the extensive software analysis performed on it. Even the most advanced AI cannot derive meaningful insights if the underlying data is flawed. Assessing this quality can be challenging, as it can be difficult to determine your true resting heart rate without access to expensive medical-grade equipment.
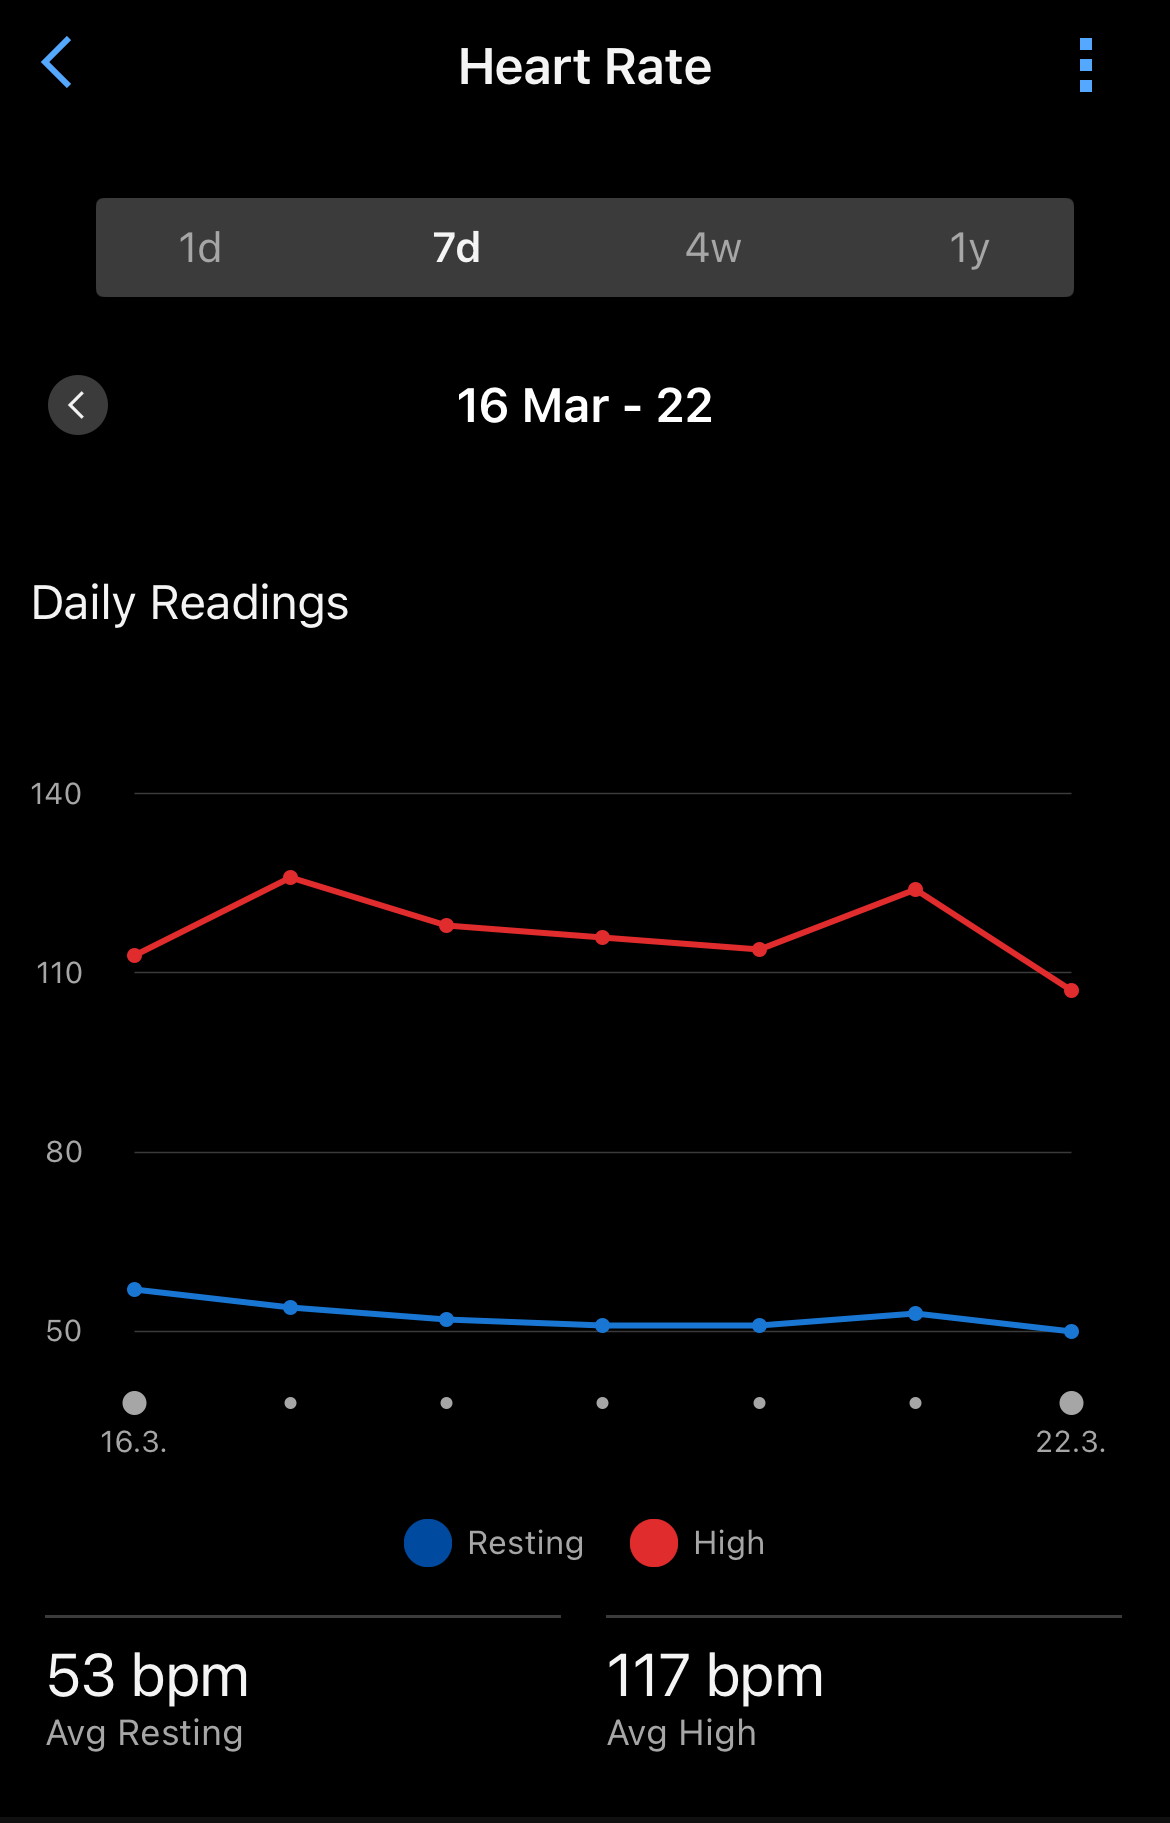
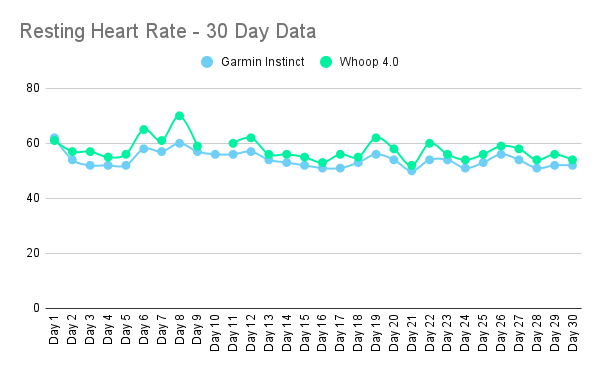
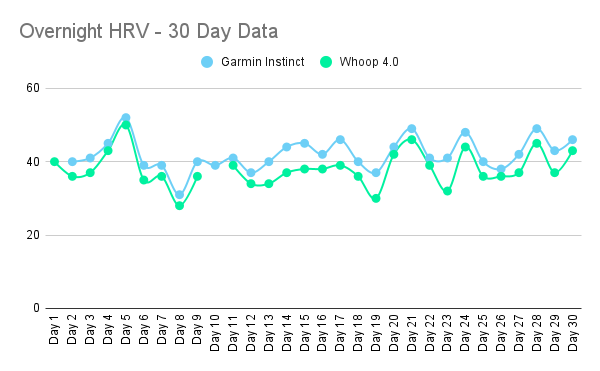
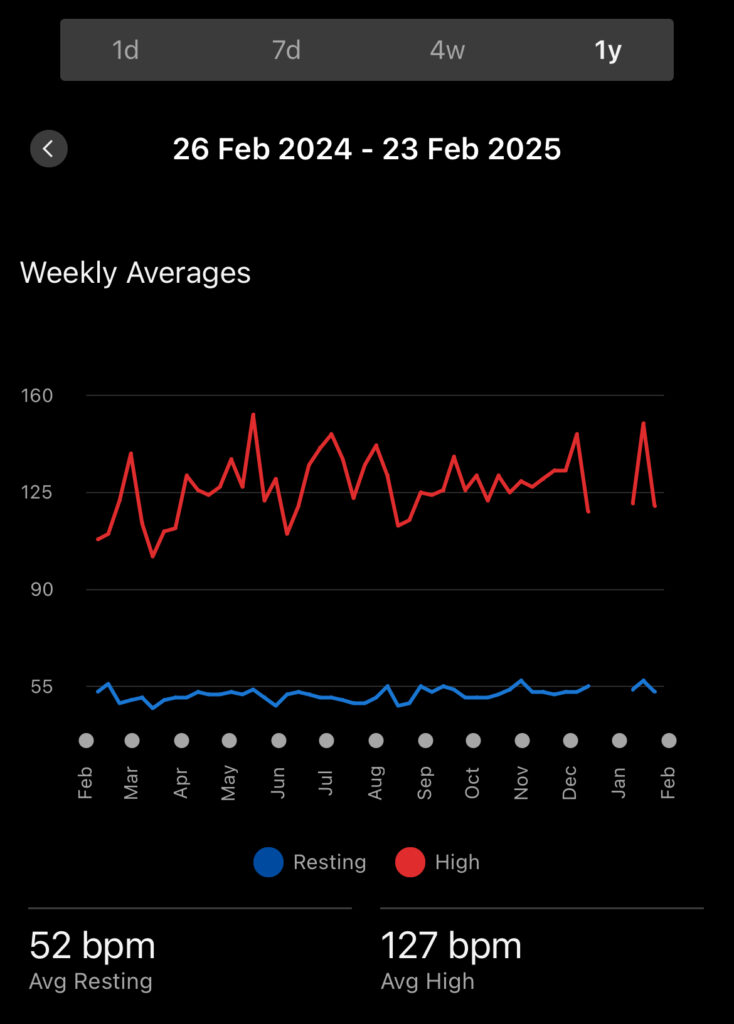
The approach I used was to compare the data collected from both devices over a 30-day period, wearing the Garmin Instinct on one wrist and the Whoop on the other. The first two graphs illustrate my resting heart rate (RHR) and overnight heart rate variability (HRV). As observed, both devices track quite well, with some exceptions. However, it is clear that the Garmin Instinct and Whoop utilize different algorithms, as the RHR values are consistently higher on the Whoop, while the HRV values are lower. Despite these differences, the overall trends align closely. While this is not scientifically rigorous (n = 1), it provides a good indication that the data gathered from both devices is likely accurate and reliable.
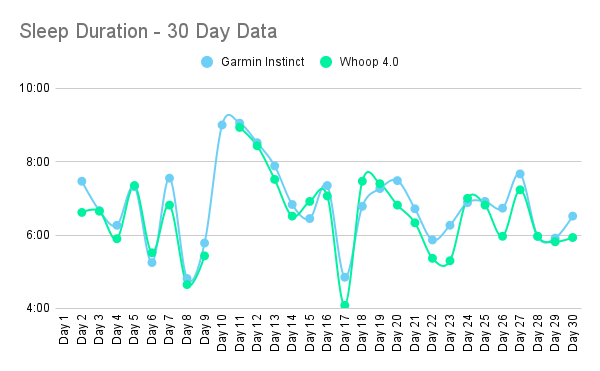
In addition to the two key heart rate data points, I also examined sleep detection. On the left side, you can see the duration of sleep detected by both devices. Overall, they appear to track similar sleep durations and generally align with the hours I feel I slept. Of course, it’s easier to know when you wake up than the precise moment when you fall asleep.
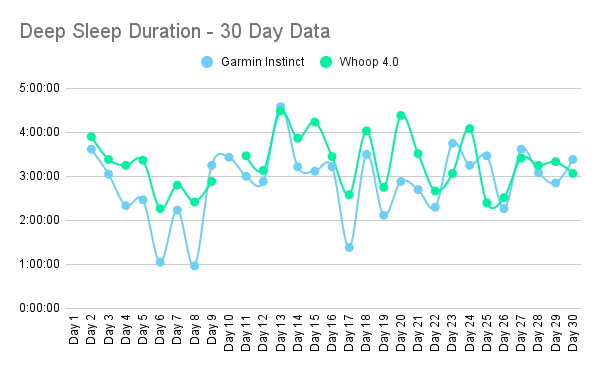
On the right side, I attempted to calculate “deep sleep” using the data. For the Whoop device, I used the value of “restorative sleep,” while for Garmin, I combined both “deep sleep” and “REM sleep” in my calculations. This may not be the best apples-to-apples comparison, and there are noticeable differences on certain days. However, in general, the data tends to track in the same direction.
The data collected by the Garmin Instinct watch and the Whoop appears to be sufficiently accurate overall and aligns well with the athlete’s perceived state. They both seem to have managed to utilize optical sensors to get meaningful data on heart parameters and sleep.
Although I haven’t conducted a fully exhaustive scientific experiment, this comparison has at least given me confidence that both devices measure meaningful data. The data aligns with my observations and feelings, making it useful overall for understanding my current state of recovery.
Using Garmin Instinct and Whoop as an activity tracker
This comparison of the hardware may seem somewhat unfair. The Whoop is designed purely as a measurement wearable. At the same time, all Garmin watches function as full smartwatches, equipped with numerous features—so many, in fact, that even many people at Garmin might not be fully aware of them all. However, both devices allow users to track activities and sync with Strava. As most people know, once an activity is logged on Strava, it not only “really happened,” but it can also be synced with various other software and apps, such as intervals.icu or TrainingPeaks, among others.
Garmin watches have an indefinite number of functions, especially the higher-end models. Who knows them all? Still, the Whoop offers excellent activity auto-detection and can nudge you towards your optimal strain of the day. It vibrates once you reach it.
With Garmin watches, you can track almost any sport directly from your wrist, thanks to the integrated GPS—no need for a mobile phone. All relevant information is displayed during your activities, and you can customize the screens to suit your preferences. The higher-end models even provide advanced, sport-specific analytics. Additionally, you can integrate extra sensors, such as a heart rate strap or a power meter.
The Whoop, on the other hand, is much more limited. Tracking can only happen from a mobile phone, so one starts tracking on the phone and stops it. However, this wasn’t the most limiting factor, as I almost always carry my phone. What limited the functionality was that I could not pause an activity. During lunch breaks or bigger breaks, I had to continue tracking.
On the other hand, the Whoop offers excellent auto-detection features, which are significantly better than those of Garmin. For instance, it reliably detects activities such as indoor cycling (labeling it as “a spin”), commuting on a bike, or even cross-country skiing. This means you may not need to manually track your activities to monitor your recovery. This data can be particularly interesting when analyzing stress levels throughout the day, as it helps differentiate between stress that occurs during activity (generally positive) and stress that occurs during non-activity (generally negative).
Another useful feature is the alarm that activates when you exceed the calculated “optimal” strain limit; the Whoop vibrates as a gentle reminder. This serves as a helpful nudge to prevent pushing yourself too hard.
Accuracy of the Garmin watches or the Whoop as a heart rate monitor
Both devices can be used as external heart rate monitors, which allow them to connect, for example, to a cycling computer. This is a convenient feature as it eliminates the need to wear an additional device. In my tests, the Whoop performed fairly accurately, while the Garmin watch proved to be unreliable at times and struggled to pick up readings correctly. The Garmin was less problematic during more static activities, like endurance indoor cycling, but faced greater challenges during more dynamic activities such as cross-country skating.
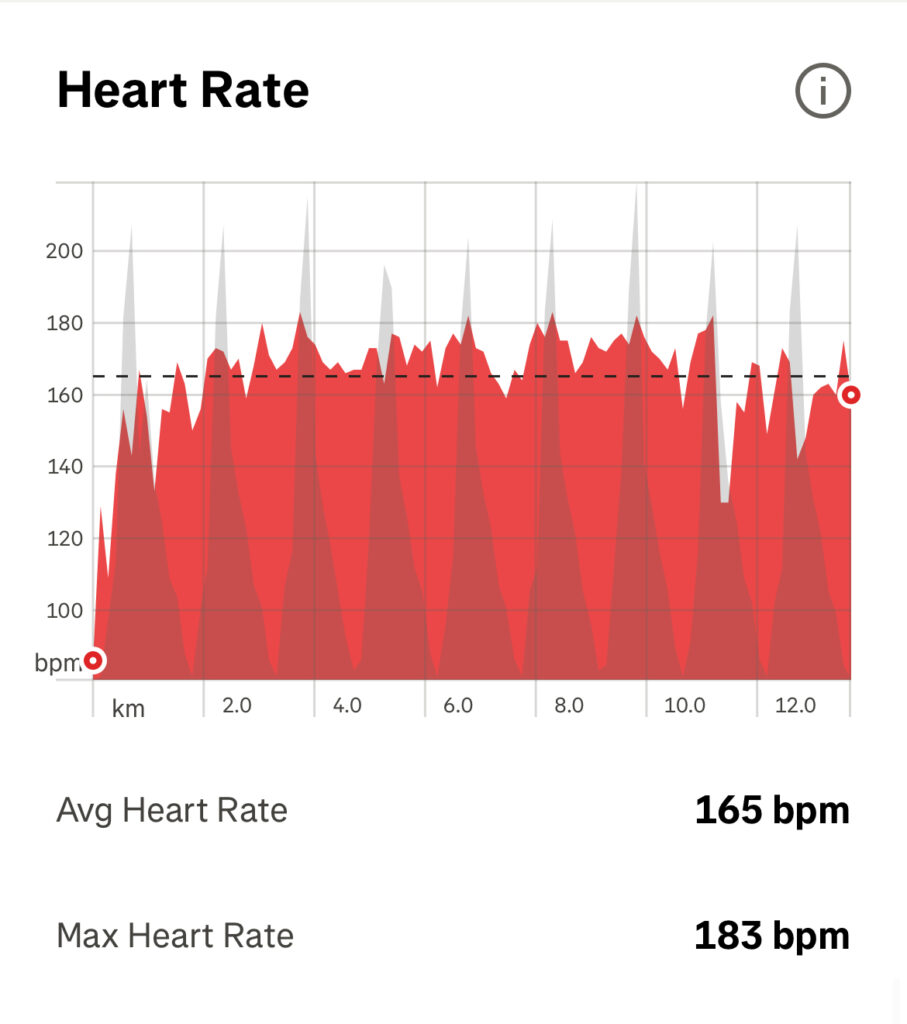
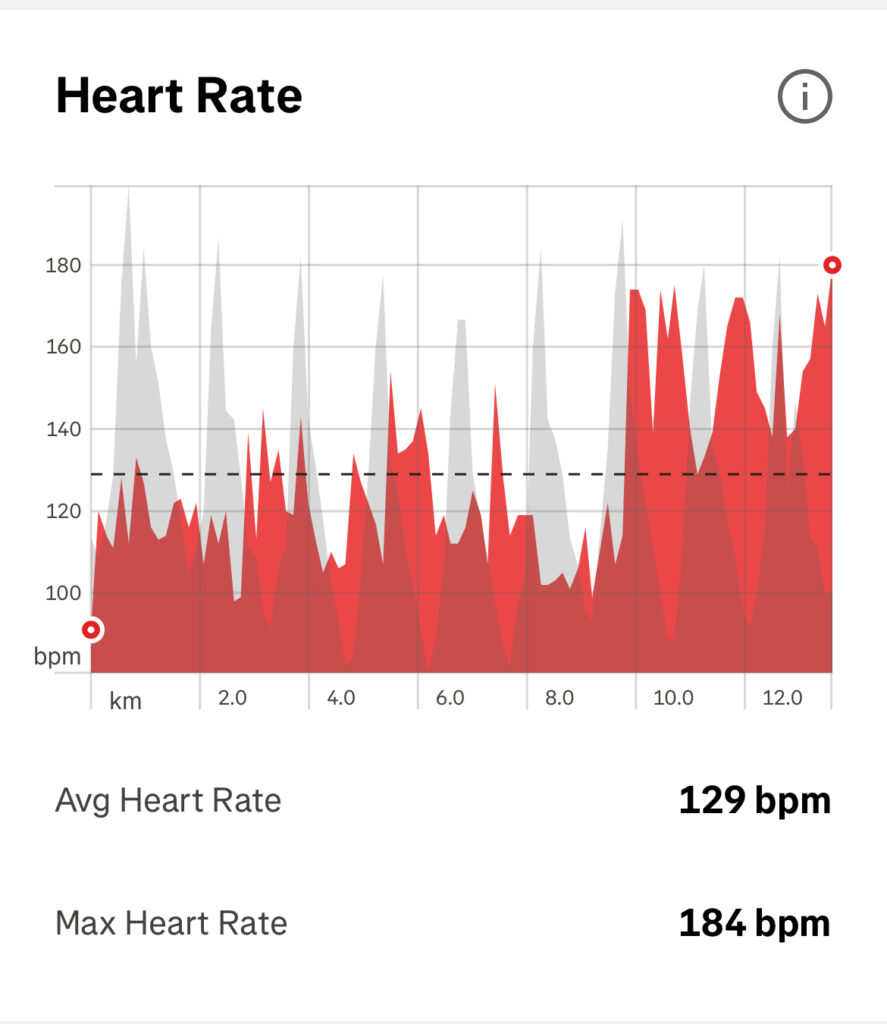
None of the optical heart rate measuring devices match the accuracy of a heart rate belt. I conducted several parallel tests, and the belt consistently reacts faster in both directions, whether the heart rate increases or decreases. Therefore, the main challenge for obtaining an accurate heart rate reading is that the wrist is not the ideal location for the device. Ideally, it should be placed behind the large wrist bone, about two finger widths from the wrist. While this positioning is somewhat unconventional for a watch, it works perfectly for the Whoop device. Additionally, the device must fit snugly during the activity to ensure accurate readings.
That said, for many rides, especially when I am primarily riding in the infamous Zone 2, I don’t mind the accuracy as much since the zone is broad. In these instances, I have had good success with optical heart rate monitors, such as the Polar OH1, but I wear them on my bicep.
The Verdict: Keep it simple and focus on action
What these devices can provide is truly impressive, especially with an added layer of AI interpretation. However, once the initial excitement has settled, the lingering question remains: What will be truly useful in the long term?
Neither Garmin nor Whoop know what you do not already
In all my years of experience and through this intensive testing phase, I have never encountered a moment when the devices provided me with information I did not already know. I am aware when I have had a poor night’s sleep or an intense training session the day before. It’s not surprising that my respiratory rate increased while I was sleeping at altitude in the Swiss Alps. The list goes on. Even the impressive AI Coach from Whoop provided accurate interpretations of my data, which is commendable but ultimately not new to me.
Neither Garmin nor Whoop ever provided me with information that I didn’t already know. They serve as useful reminders, but they cannot predict the future effects of my actions. Ultimately, understanding my own body remains the most effective approach.
What they could not do, was actually know something before I would. It seems still my feeling trumps the data. I wished, the technology was able to warn me before I would fall ill and avoid that training session right before Covid hit me down for 2 months. But at least currently, it cant. The simple subjective feeling is still the most accurate, if you learn to listen to your body.
Data can help to know yourself, but acting on it is most important
Ultimately, the data or information itself is not what truly matters; what counts is making it actionable. Both devices recognize this and have implemented various features, but I’m uncertain about how much they actually help.
Garmin has a good feature with the “Morning Report,” and the simple composite parameters like “Training Readiness” are self-explanatory. The Whoop has done a formidable job at trying to coach you towards more sleep and better habits. The journaling function is very well implemented. On the other hand, I cannot relate to the “strain” and recovery values on some scientific, non-linear scales. Why is a resting day 5.3 and a super hard day 19.7 strain? I know this is based on the Borg scale, but it’s nevertheless not intuitive.
Even if we get perfectly accurate data, will we change? Recovery is hard! For most of us working full-time, the weekend is the time to bring in the big days out, maybe together with some friends. Will you cancel that ride when the weather looks great just because data indicates to do so? It was even more striking to me, when I looked at my sleep data.
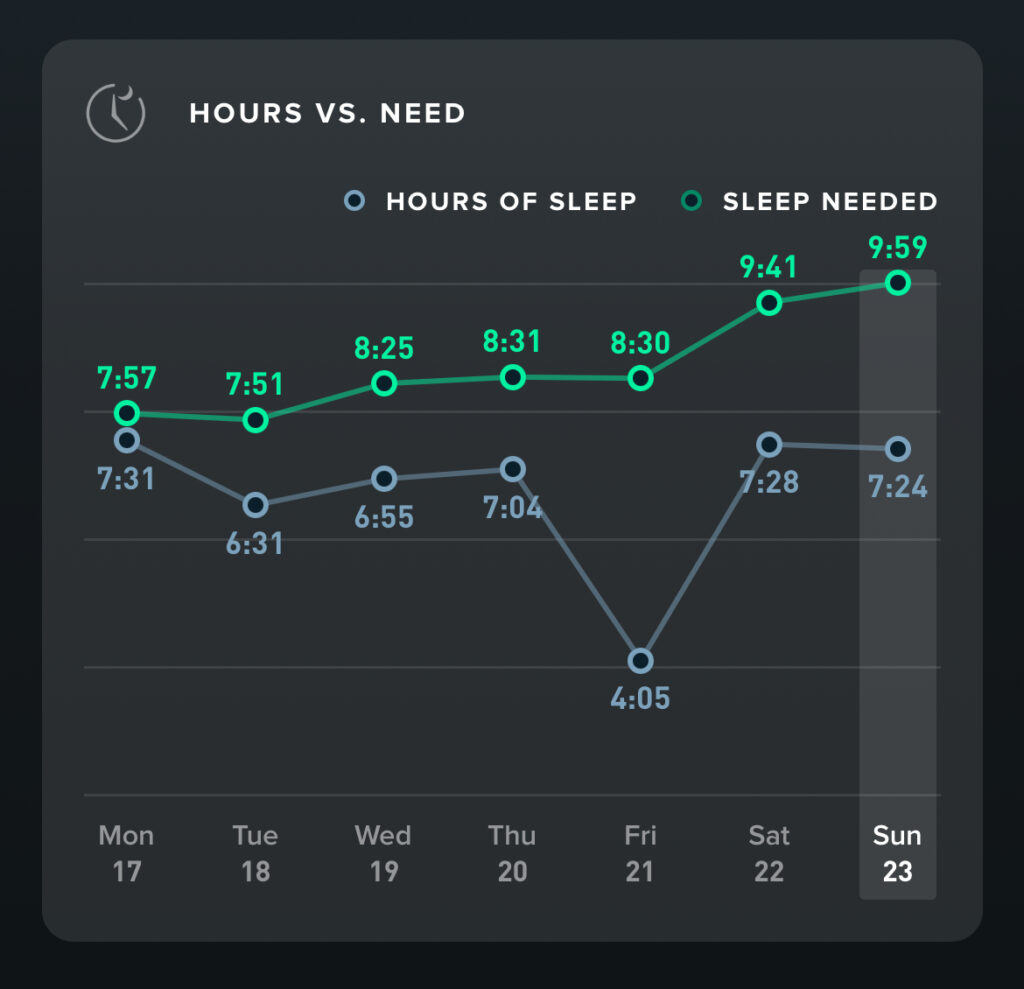
struggle with all the work commitments and interests. (February 2025)
As seen in the graph above, I do not get enough sleep. Aside from the obvious outlier, addressing this issue would require significant changes in my life. First, I would likely need to become a full-time athlete without any other obligations. Secondly, I’m not even sure if I could train my body to sleep for 10 consecutive hours. Therefore, having Whoop repeatedly remind me of my sleep debt doesn’t help; I need more personalized coaching with manageable steps. Since this level of achievement seemed unrealistic for me, I eventually stopped trying to improve my sleep.
Structure your training around a few parameters
For many, focusing on just one parameter can be sufficient to plan the next training days effectively. Additional data may either provide similar insights or, at worst, create even more confusion. Therefore, I recommend structuring your training around a few key parameters.
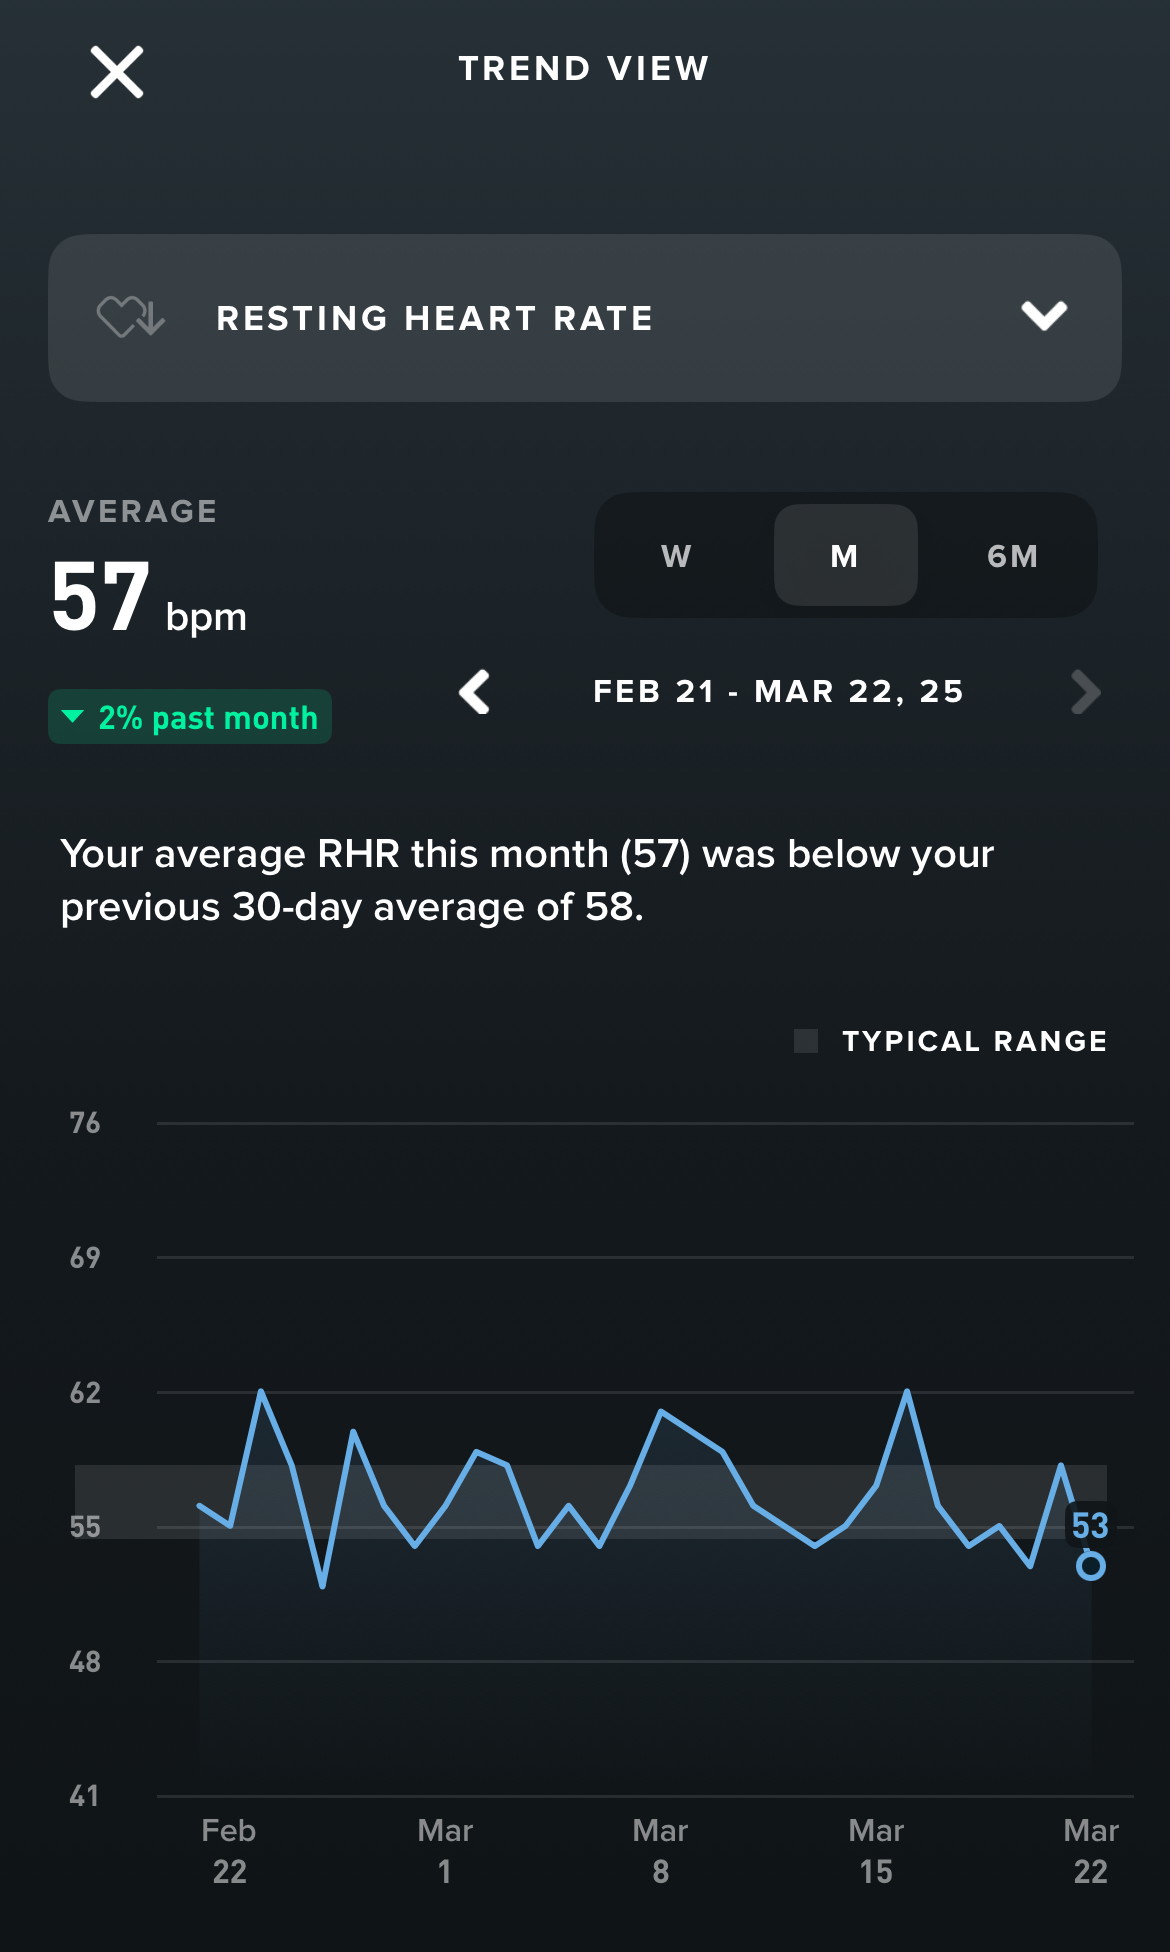
The health data provided by Garmin and Whoop can often lead to confusion and “data paralysis,” particularly when the metrics contradict each other. Stick to just one or two parameters to guide your decisions. Personally, I prefer to use resting heart rate (RHR) as my primary metric.
One useful metric could be “Training Readiness” from Garmin; if your readiness is low, it might be best to either rest or engage in light activities. Similarly, the Whoop device offers insights into optimal strain levels, but don’t get caught up in the specific numbers. It’s less important whether the strain level is 6.3 or 12.8; the key factor is whether it is high or low.
My parameter of choice: Resting Heart Rate (RHR)
I have decided to focus on my resting heart rate (RHR) once again. Through years of experimentation and observation, I’ve found that RHR responds most quickly to stress, endurance training, and sleep. I’ve learned what my typical values are based on my Garmin device (as opposed to Whoop, which measures differently). When my RHR is below 50, I feel genuinely relaxed, well-rested, and not stressed. If it rises above 55, it indicates that there might be an issue, whether it’s due to intense training, which I would already be aware of, or some other factor. In such cases, it’s best to take it easy or rest. Extremely high values signal an urgent need for immediate rest. That’s my approach—it’s a straightforward three-zone system that works well for me.
After going through this long article, it might be a bit disappointing to conclude that the classic resting heart rate is still the most effective measure for me. Despite the advancements in technology, I find that this simple and well-known parameter remains the most reliable option.
 Made me Slower
 Same, Same
 Made me Faster